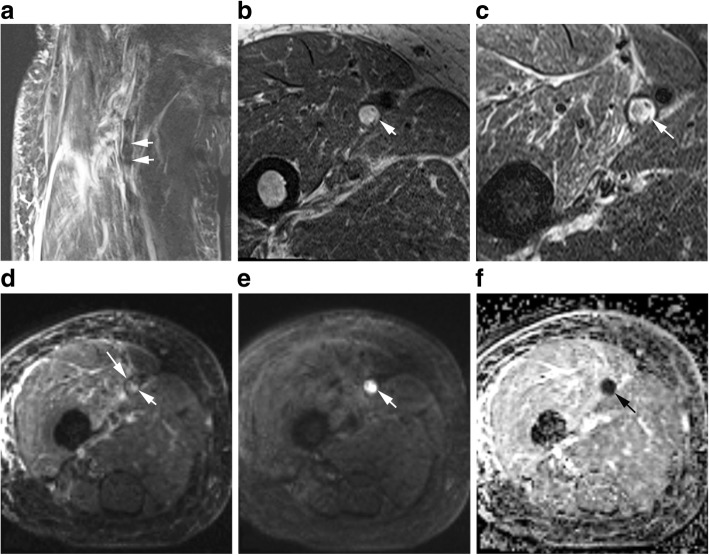
Fig. 3.
Fifty-seven years old female participant with lower extremity edema. This acute DVT was heterogeneously hypointense on SPACE (a, arrows), mixed hyper- and hypointense on T1 (b, arrow) and T2 (c, arrow) weighted images. The DVT signal on b = 0 image (d, arrow) is similar to that on T2 images. On the b = 800 image (e, arrow), the thrombus was extremely high signal. On the apparent diffusion coefficient (ADC) map (f, arrow), the thrombus was darker than background. E and F provided adequate thrombus-to-background contrast, but D did not

