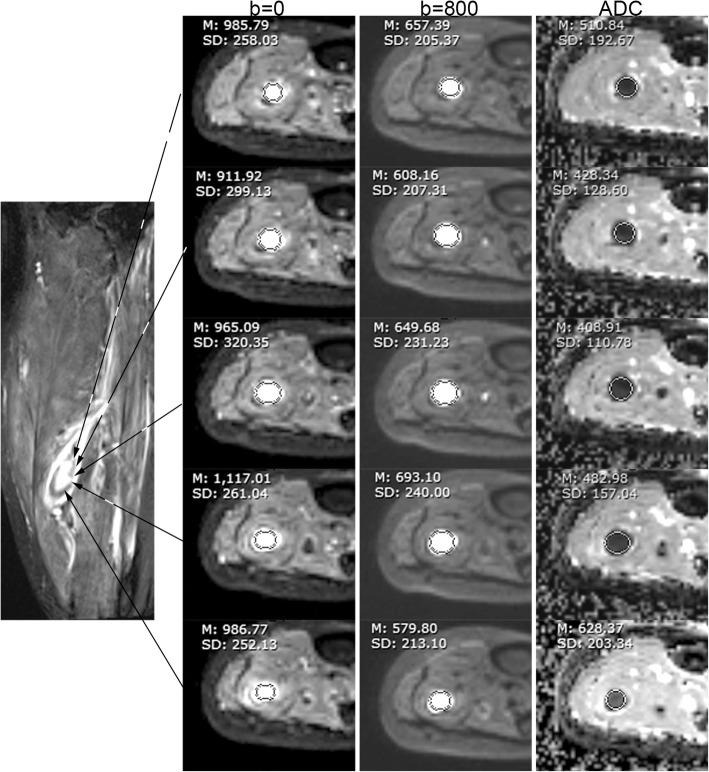
Fig. 4.
Sixty-five years old male participant with edema and pain of calf. From left to right, the columns are an SPACE, b = 0, b = 800, and ADC map. On SPACE, this acute DVT was centrally hyperintense and peripherally hypointense. On the b = 0 and 800 images, the DVT was hyperintense. The DVT was hypointensity on ADC map. All values acquired in the regional of interest (ROI) analysis indicated acute DVT

