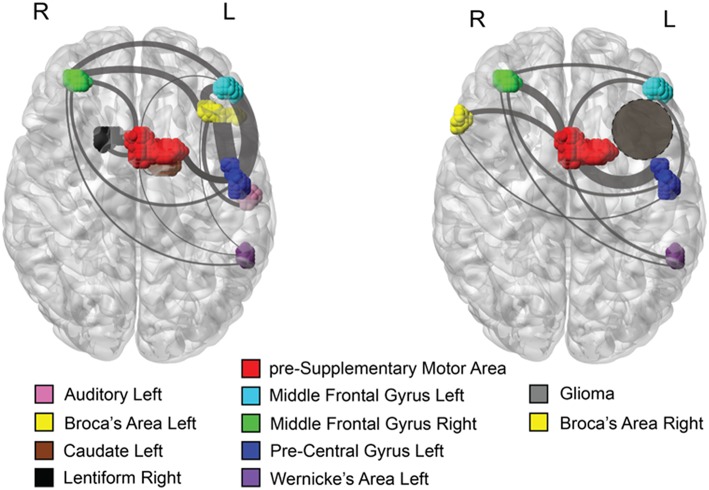
Figure 2.
Axial views of the brain with active fMRI areas and links obtained by statistical inference. (Left) Brain network topology inferred from a semantic fMRI task for a typical healthy control subject. The primary language areas, BA and WA, are identified in the left hemisphere and are functionally connected. (Right) the network consistently found across all the fMRI scans for the patient with left insular glioma. The homolog of the BA on the right hemisphere becomes statistically active and connects with several other active brain areas, implicating a functional reorganization of the brain areas involved in a language task. As opposed to the typical healthy brain, this patient's right BA does not connect directly with the left WA. Functional communication between these two areas is conveyed through a common area to which they are both linked, the pre-SMA. Gray lines represent functional connectivity, line thickness is proportional to the strength of connectivity, whereas their arrangement is made to facilitate visualization. In both panels, colors indicate different brain regions as reported in the legend.

