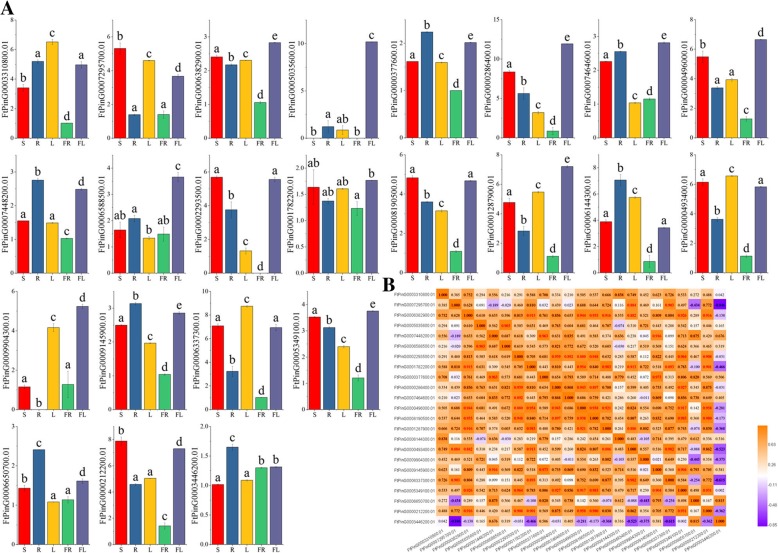
Fig. 7.
Tissue-specific gene expression of 23 tartary buckwheat SPL genes and the correlation between the gene expression patterns of FtSPLs.a The expression patterns of 23 tartary buckwheat SPL genes in flower, leaf, root, stem and fruit tissues were examined by qPCR. Error bars were obtained from three measurements. Lowercase letter(s) above the bars indicate significant differences (α = 0.05, LSD) among the treatments. b Positive number: positively correlated; negative number: negatively correlated. The red numbers indicate a significant correlation at the 0.05 level.

