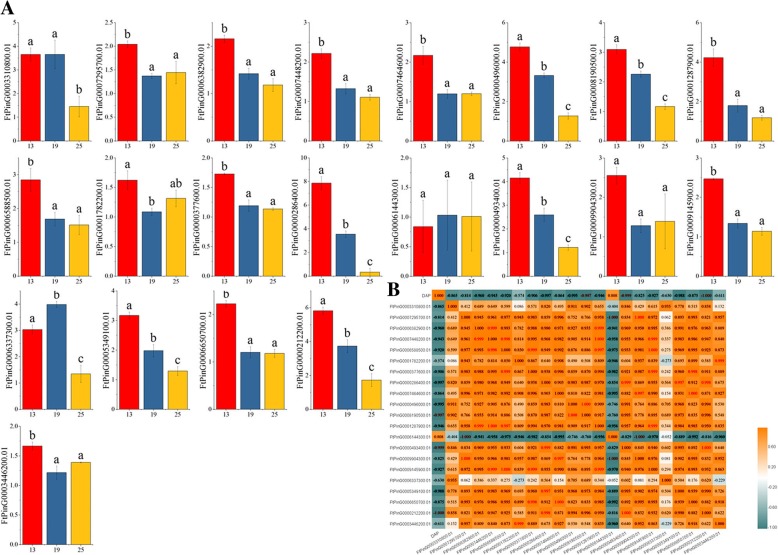
Fig. 8.
Gene expression of 21 tartary buckwheat SPL genes during fruit development and the correlation between the gene expression patterns of FtSPLs during fruit development. a The expression patterns of 21 tartary buckwheat SPL genes in the fruit development stage were examined using a qPCR assay. Error bars were obtained from three measurements. Lowercase letter(s) above the bars indicate significant differences (α = 0.05, LSD) among the treatments. b Positive number: positively correlated; negative number: negatively correlated. Red numbers indicate a significant correlation at the 0.05 level

