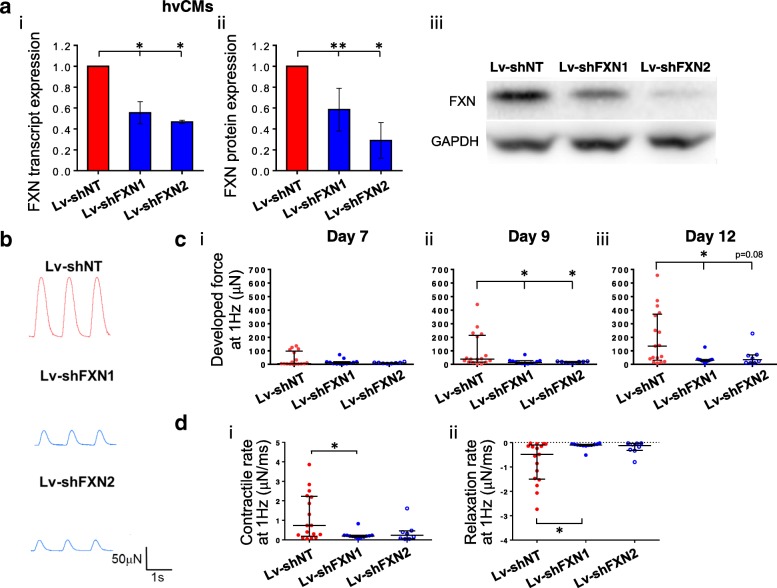
Fig. 2.
Isogenic FRDA cardiac model derived from hESCs. a FXN (i) transcript and (ii) protein expression (normalized to GAPDH expression) and (iii) representative Western blot image of hESC-hvCMs transduced with Lv-shFXN1 and Lv-shFXN2, relative to batch-matched control transduced with Lv-shNT (n = 3–6). Transcript and protein data were generated from 3 to 6 and 3 to 5 independent differentiation batches, respectively. Data are shown as mean ± SEM. b Representative contractile force traces on day 12 for hESC-hvCTS transduced with Lv-shFXN1 and Lv-shFXN2, with Lv-shNT as control. c Developed force generation on (i) day 7, (ii) day 9, and (iii) day 12 from 1 Hz-paced hESC-hvCTS transduced with Lv-shFXN1 (n = 12) and Lv-shFXN2 (n = 8), compared to control transduced with Lv-shNT (n = 17). hESC-hvCTS force generation data originated from 3 to 6 independent batches of differentiation. d Kinetics analysis of (i) contractile rate and (ii) relaxation rate of hESC-hvCTS force generation on day 12. All force generation data are shown as median with interquartile range. Statistical significance indicated by *p < 0.05 and **p < 0.01

