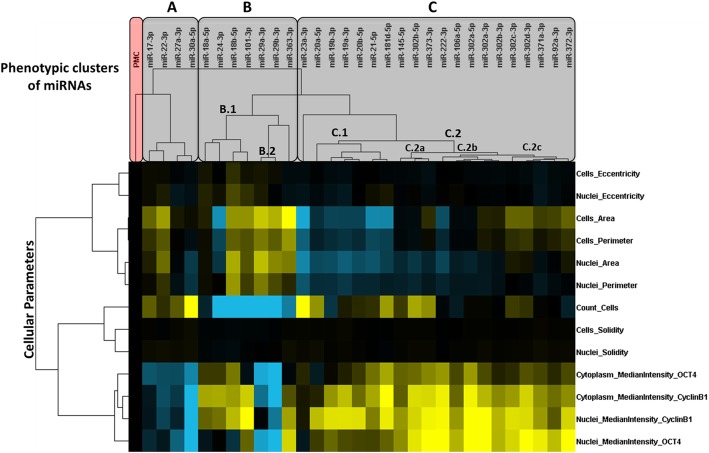
Fig. 4.
Clustering of miR-induced multiparametric phenotypic profiles in H1 hESCs. H1 hESCs were transfected with miR mimics and the negative control miR-Ctr (PMC) and then submitted to quantitative fluorescence microscopy. Multiparametric phenotypic profiles specific for each miR were submitted to hierarchical clustering analysis (centered correlation and average linkage). The resulting dendograms above or to the left of the heatmap indicate, respectively, the similarities between the phenotypes induced by miRs (potentially reflecting shared targets and mechanisms of action) or the correlation between distinct phenotypic features. The measurements depicted in the heatmap were calculated as percentage of control (POC) (PMC in black). Highest POC values above or below the control are represented in bright yellow or blue, respectively

