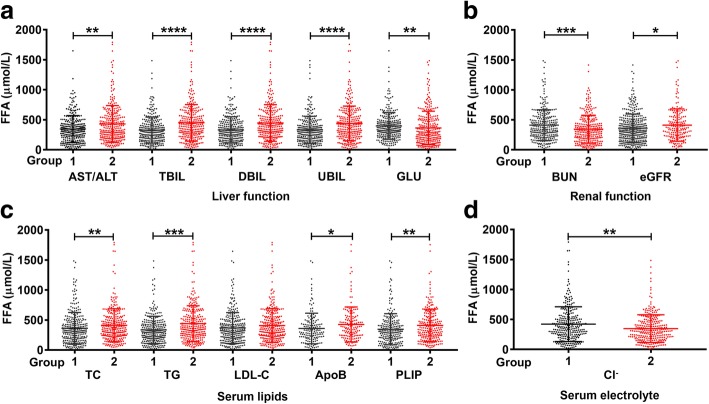
Fig. 3.
The differences of serum FFAs between groups. a Liver function. b Renal function. c Serum lipids. d Serum electrolytes. Group-1 ≤ the median and Group-2 > the median. The median of each parameter was: AST/ALT, 1.38; TBIL, 8.6 μmol/L; DBIL, 1.5 μmol/L; UBIL, 7.05 μmol/L; GLU, 5.31 mmol/L; BUN, 17.4 mmol/L; TC, 3.75 mmol/L; TG, 1.41 mmol/L; LDL-C, 1.96 mmol/L; ApoB, 0.66 g/L; PLIP, 2.04 mmol/L; Cl−, 104.25 mmol/L. The cutoff value for eGFR grouping is 15 mL/min/1.73m2. *P < 0.05, **P < 0.01 ***P < 0.001, ****P < 0.0001. ALT, alanine transaminase; AST, aspartate aminotransferase; TBIL, total bilirubin; DBIL, direct bilirubin; UBIL, unconjugated bilirubin; GLU, glucose; BUN, blood urea nitrogen; eGFR, estimated glomerular filtration rate; TC, total cholesterol; TG, triglyceride; LDL-C, low-density lipoprotein cholesterol; ApoB, apolipoprotein B; PLIP, phospholipid

