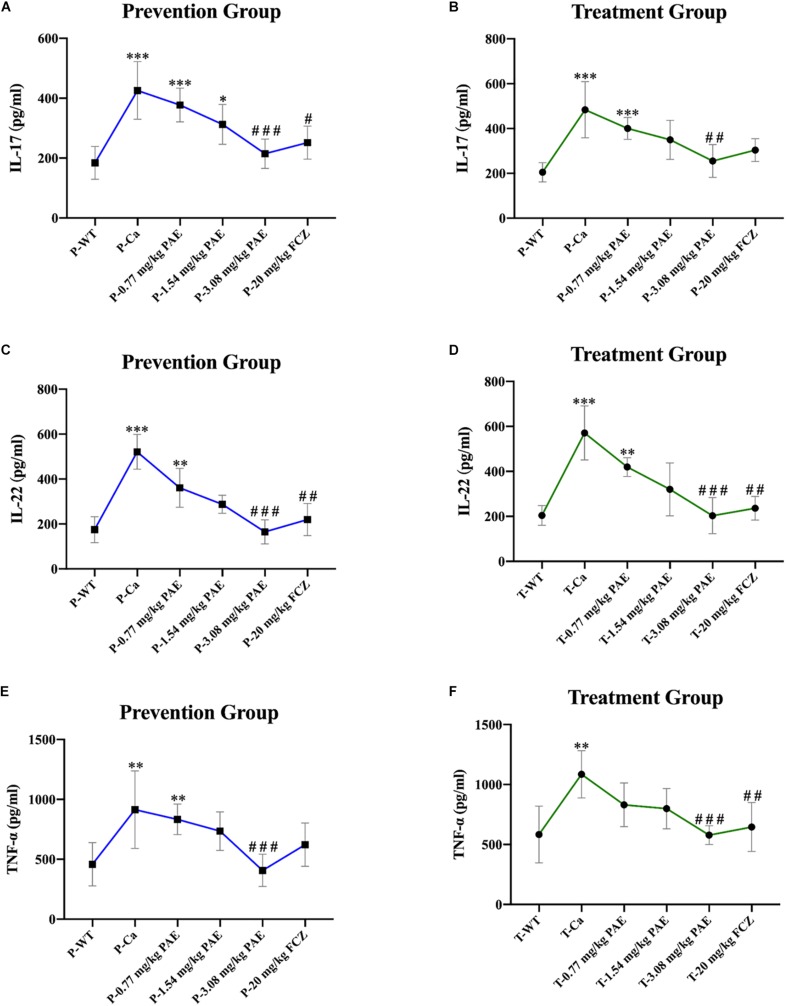
FIGURE 8.
Pro-inflammatory cytokines IL-17, IL-22, and TNF-α detected in mouse vaginal tissue. (A,B) Shows elevation of IL-17 concentration detected by ELISA in both the prevention and treatment groups. * means p < 0.05, ∗∗∗ means p < 0.001, compared with the WT group, # means p < 0.05, ### means p < 0.001 compared with the Ca group. (C,D) Elevation of IL-22 concentration detected by ELISA in the prevention and treatment groups. ∗∗ means p < 0.01, ∗∗∗ means p < 0.001, compared with the WT group, ## means p < 0.01, ### means p < 0.001 compared with the Ca group. (E,F) Elevation of TNF-α concentration detected by ELISA in both the prevention and treatment groups. ∗∗ means p < 0.01, ∗∗∗ means p < 0.001 compared with the WT group, ## means p < 0.01, ### means p < 0.001 compared with the Ca group.

