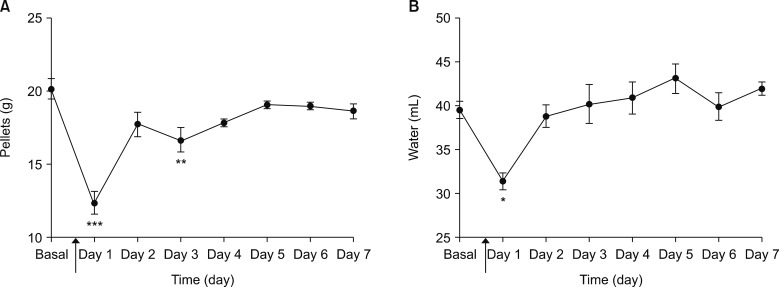
Fig. 5.
Assessment of metabolic function in control animals. Time of incision is indicated (line arrow). Feeding behaviour was affected at days 1 and 3 (A) and drinking on day 1 (B) after incision. All values were compared to baseline intake. Values are represented as mean ± standard error of mean. Food consumption was expressed as g/day. n = 6 at each time point. *P < 0.05, **P < 0.01, ***P < 0.001.

