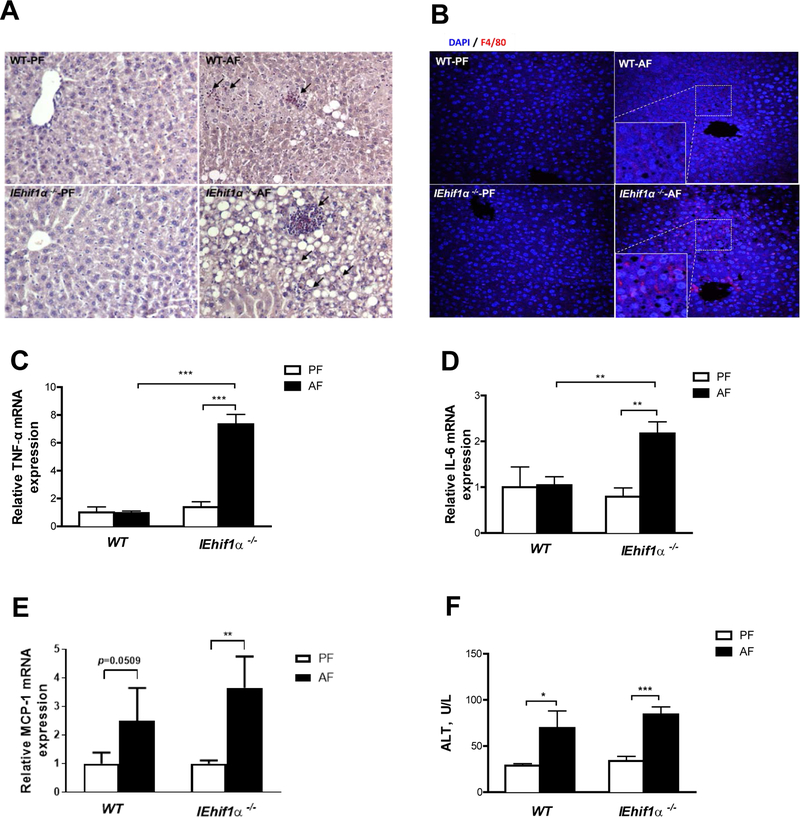
Figure 2.
Inflammatory responses in EtOH-induced liver injury. WT and IEhif1α−/− mice were pair- or alcohol-fed for 24 days. (A) Chloroacetate esterase (CAE) localization (cell-localized fuchsia staining) in livers. Original magnification, ×10. Arrows indicate neutrophil infiltration. (B) F4/80 staining of the liver tissues. DAPI (blue) was used to counterstain nuclei. Original magnification, ×10. (C, D, E) Hepatic gene expression of proinflammatory cytokines TNF-α, IL-6 and chemokine MCP-1, respectively. (F) Serum alanine aminotransferase (ALT) activities. Data are expressed as mean ± SEM. AF, alcohol-fed; PF, pair-fed.

