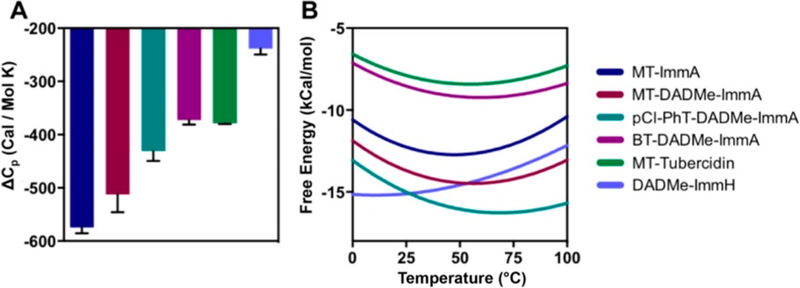
Figure 43.

Heat capacity changes and optimal binding temperatures for MTAP. (A) ΔCp for inhibitor binding. DADMe-ImmH binding to PNP (9 pM) is included as a control. (B) Free energy of inhibitor binding to MTAP as a function of temperature. Optimal binding temperature is the minima. DADMe-ImmH binding to PNP is added for comparison. Reproduced from ref 255. Copyright 2016 American Chemical Society.
