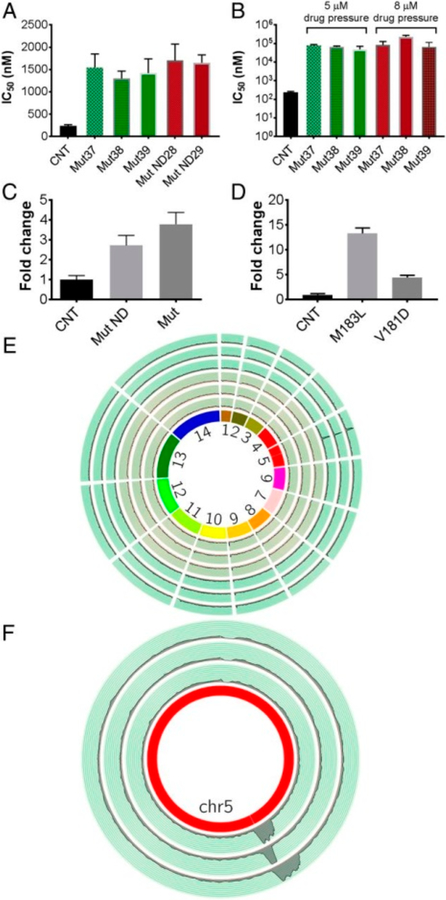
Figure 82.
Characteristics of P. falciparum resistant to DADMe-ImmG. (A) IC50 values for P. falciparum growth for clones with 5.5–7.2-fold increased IC50 values. (B) IC50 values for P. falciparum growth for clones with 260–980-fold increased IC50 values. (C) Western blot intensity for PfPNP protein in drug-resistant clones. (D) Western blot intensity from highly resistant clones. (E) P. falciparum chromosomes (innermost circle). Peak height is relative to genomic reads of 10 kb contiguous regions. Three control clones (inner tracks) show no amplified regions. Three outer tracks correspond to 2 μM DADMe-ImmG-resistant isolates. Amplified Pf PNP regions are seen in all resistant strains in chr5. (F) Gene amplification in chr5 for three highly–resistant clones. Clones have distinct boundaries for gene amplification, each containing the coding region for the PfPNP gene. Reproduces with permission from ref 439. Copyright 2018 National Academy of Sciences.

