Figure 3.
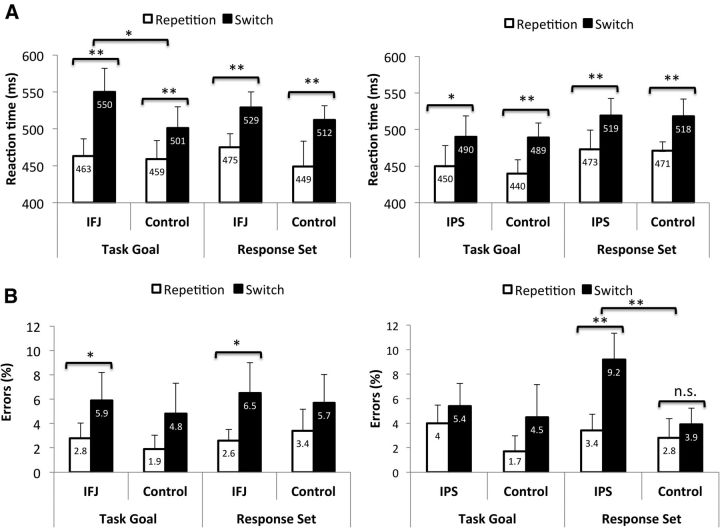
Reaction times (A) and error rates (B) of Experiments 1 (left) and 2 (right) as a function of the target site, block type, and trial transition. Note: The displayed values are means and within-subject confidence intervals (calculated according to Loftus and Massen, 1994). Asterisks indicate significant differences between repetition and switch trials, as well as differences in switch costs between target and control site stimulation.

