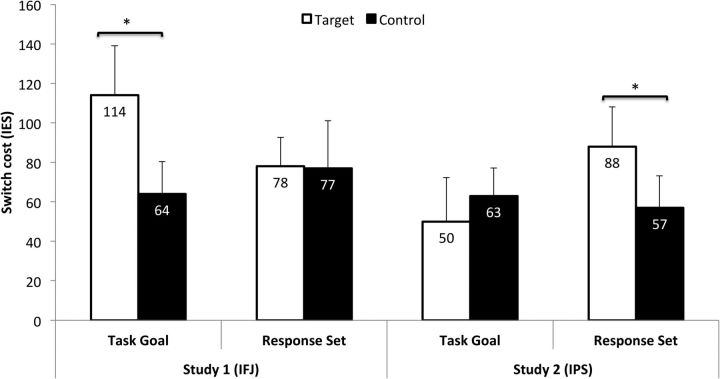
Figure 4.
Pooled analysis of results across Experiments 1 and 2. Performance on each block type is expressed as difference between switch trials and repetition trials using IES to integrate speed and accuracy into a single measure. IESs are computed by dividing the reaction time of a design cell by the percentage of correct responses. Note: The displayed values are means and SEs. Asterisks indicate significant differences in switch costs between target site and control site stimulation.

