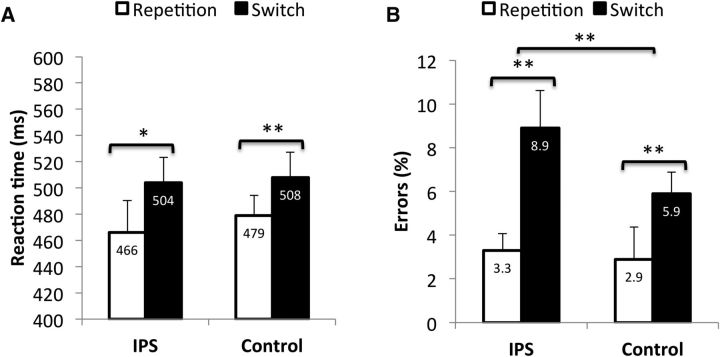
Figure 6.
Reaction times (A) and error rates (B) of Experiment 3 as a function of target site and trial transition. Asterisks indicate significant differences in switch costs with stimulation of the target site and stimulation of the control site. Note: The displayed values are means and within-subject confidence intervals (calculated according to Loftus and Massen, 1994).

