Figure 1.
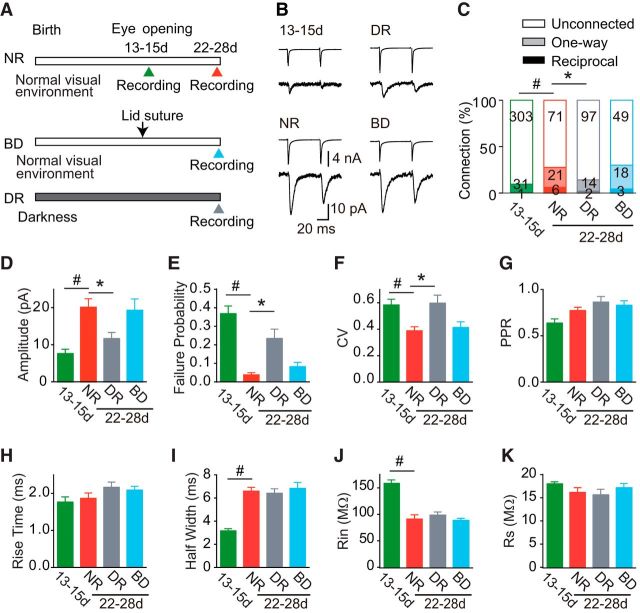
Experimental schedule and development of unitary EPSCs between adjacent L2/3 pyramidal cell pairs. A, Manipulation of visual experience and timeline of the experiments. Recordings were obtained from rats just after eye opening [P13–P15 (13-15d)], and from 3-week-old rats [P22–P28 (22-28d)] reared normally (NR), with binocular deprivation (BD), and in darkness (DR). B, Example average (n = 8) traces of presynaptic action currents evoked by depolarizing voltage pulses (top) and resultant EPSCs (bottom), which were obtained from cell pairs in each of the experimental groups. Calibrations are common to all traces. C, Percentage of cell pairs that were connected in both directions (dark bar), in one direction (light bar), or not connected (blank bar). The numbers of cell pairs are indicated in the bars. χ2 Test; #p < 0.05 between normal rats at P13–P15 (13-15d) and P22–P28 (22-28d), and *p < 0.05 versus normal rats (comparison between the 3-week-old groups). D–I, A bar graph shows the value (mean ± SEM) of amplitude (D), failure probability (E), CV (F), PPR (G), 10–90% rise time (H), and half-width (I) of unitary EPSCs recorded from connected pairs. In A, the amplitude of EPSCs was averaged for all of the stimulation trials, including those that resulted in transmission failure. J–K, Input resistance (J, Rin) and series resistance (K, Rs) of postsynaptic cells. In D–K, the number of cell pairs was 32 (13-15d), 27 (NR), 16 (DR), and 21 (BD). Mann–Whitney test; #p < 0.05 between normal rats at P13–P15 (13-15d) and P22–P28 (22-28d). Dunn's test; *p < 0.05 versus normal rats (comparison between the 3-week-old groups).

