Figure 5.
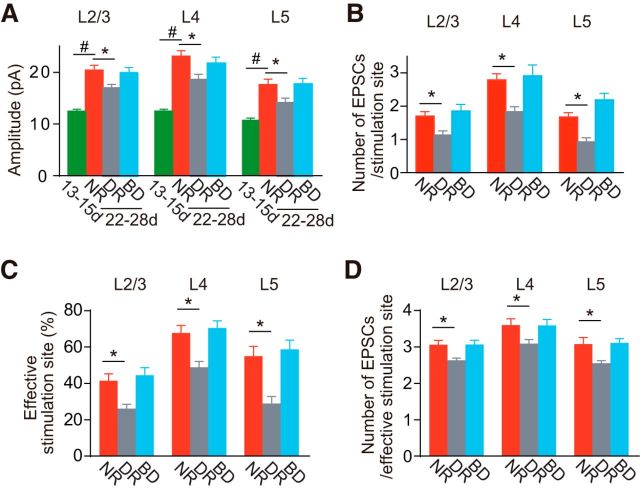
Comparison of photostimulation-evoked EPSCs. A, The amplitude of EPSCs (mean ± SEM) evoked by photostimulation of each layer, expressed as an average for all stimulation sites in the relevant layer, in rats at P13–P15 (13-15d, n = 66 cells) and 3-week-old rats (22-28d) reared normally (NR, n = 30), in darkness (DR, n = 36), and with binocular deprivation (BD, n = 28). Mann–Whitney test; #p < 0.05 between normal rats at P13–P15 and P22–P28. Dunn's test; *p < 0.05 versus normal rats (comparison between the 3-week-old groups). B, The number of EPSCs (mean ± SEM) evoked by photostimulation of each layer in 3-week-old rats reared normally (NR, n = 30 cells), in darkness (DR, n = 36), and with binocular deprivation (BD, n = 28). Dunn's test; *p < 0.05 versus normal rats. C, D, Similar to B, but the percentage of effective stimulation sites eliciting ≥2 EPSCs (C) and the number of EPSCs (mean ± SEM) evoked by the stimulation of effective stimulation sites (D).

