Figure 6.

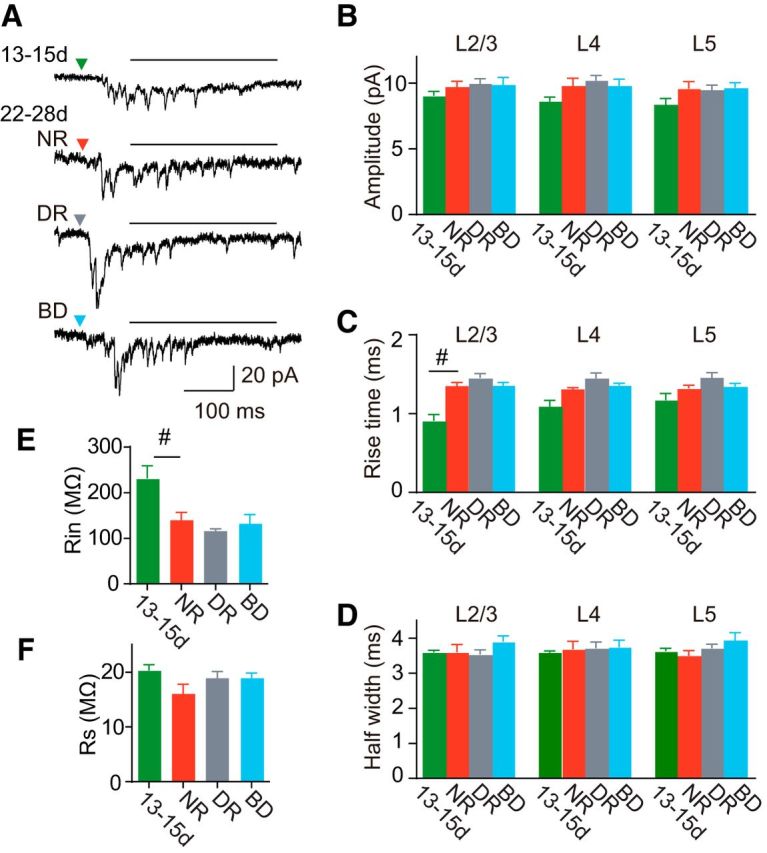
Comparison of photostimulation-evoked quantal EPSCs. A, Representative asynchronous EPSCs recorded from a rat at P13–P15 (13-15d) and 3-week-old rats (22-28d) reared normally (NR), in darkness (DR), and with binocular deprivation (BD). The horizontal line on each trace indicates the temporal window for the analysis of asynchronous EPSCs. B–D, The amplitude (B), 10–90% rise time (C), and half-width (D) of quantal EPSCs estimated from asynchronous EPSCs, which were sampled from 100 to 400 ms (A, horizontal bar) after photostimulation. E, F, Input resistance (E) and series resistance (F) of recorded cells (13-15d, n = 8 cells; NR, n = 5 cells; DR, n = 9 cells; BS, n = 5 cells). Mann–Whitney test; #p < 0.05 between normal rats at P13–P15 and P22–P28. No significant differences (Kruskal–Wallis test, p > 0.26) were found in any of parameters shown in B–F between the 3-week-old groups.
