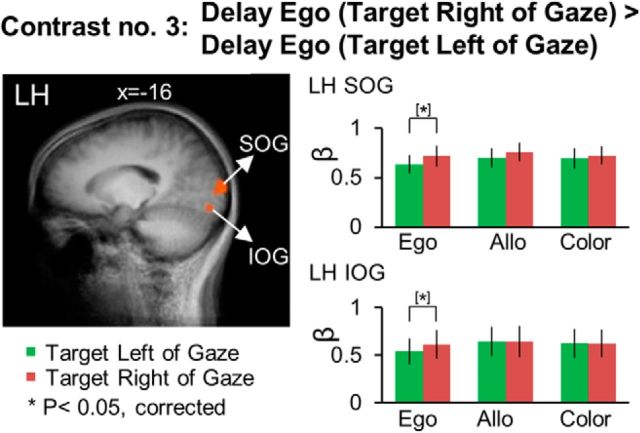
Figure 6.
Voxelwise statistical map obtained with the RFX GLM and activation levels for each area shown with the Contrast no. 3, [Delay Ego (Target Right of Gaze) > Delay Ego (Target Left of Gaze)]. Left, Activation map overlaid on the averaged anatomical image from all 12 participants. Right, Bar graphs represent the β weights for each condition in each area. Legends as in Figure 3.

