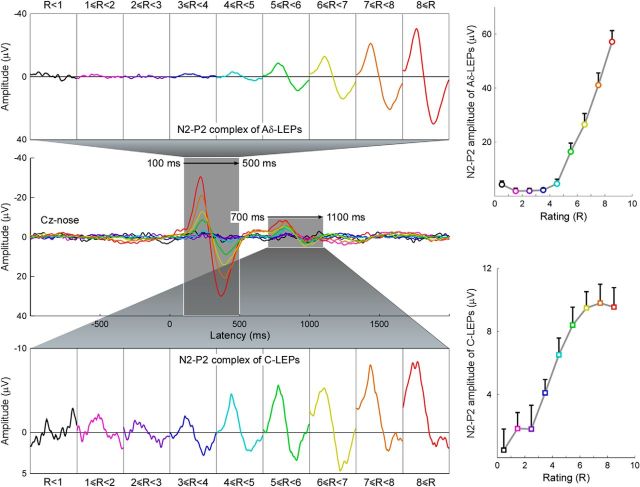
Figure 4.
Relationship between LEP amplitude and subjective pain intensity. Left, Group-level average LEP waveforms, sorted according to perceived pain intensity (from 0 to 10, in steps of 1). The time windows of the N2–P2 complex at late (100–500 ms) and ultralate (700–1100 ms) latencies are enlarged and displayed side-by-side in the top and bottom parts of this figure, respectively. Right, Amplitudes of late (top) and ultralate (bottom) N2–P2 complexes at each level of perceived pain intensity. Note how the late N2–P2 amplitudes increase significantly when the subjective pain intensity is larger than 5. In contrast, the ultralate N2–P2 amplitudes increase significantly up to the subjective pain intensity of 5.

