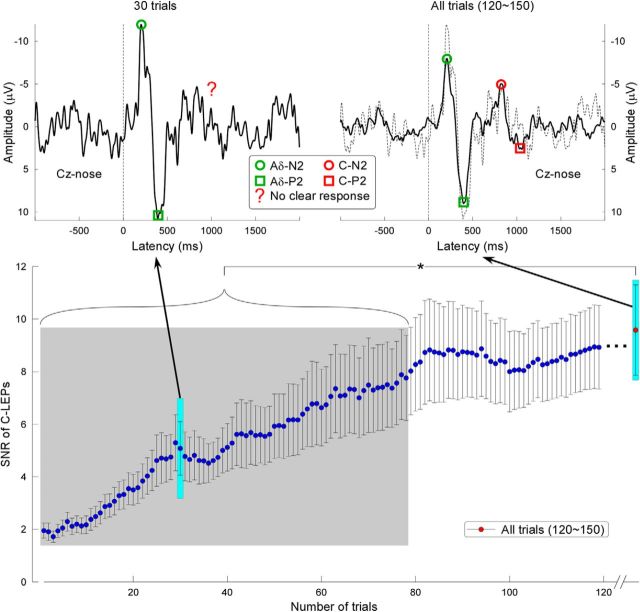
Figure 6.
Effect of number of stimuli on the SNR of C-LEPs. Top, LEP waveforms obtained averaging 30 randomly selected trials (left) and all trials (right) of a representative subject. Green and red denote Aδ- and C-LEPs, respectively. Circles and squares denote N2 and P2 peaks, respectively. The red question mark shows an unclear C-LEP response. Bottom, SNR of the C-LEPs is markedly enhanced when the number of stimulus repetitions is increased. The SNR of the C-LEP obtained averaging all trials is significantly higher than the SNR of C-LEPs obtained averaging <79 trials (t(33) > 2.84, pfdr < 0.05, paired sample t test).

