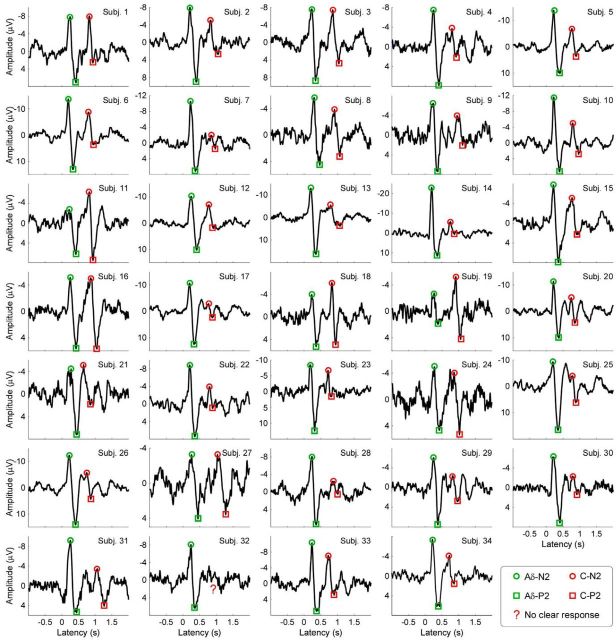
Figure 8.
Aδ- and C-LEPs in each of the 34 participants of Experiment 1. Displayed signals were recorded from the vertex (Cz vs nose reference). For each of the 34 participants, LEP waveforms are averaged across trials in the time domain. Green and red denote Aδ- and C-LEP responses, respectively. Circles and squares denote N2 and P2 peaks, respectively. Unclear C-LEP responses are highlighted with red question marks.

