
Figure 5.
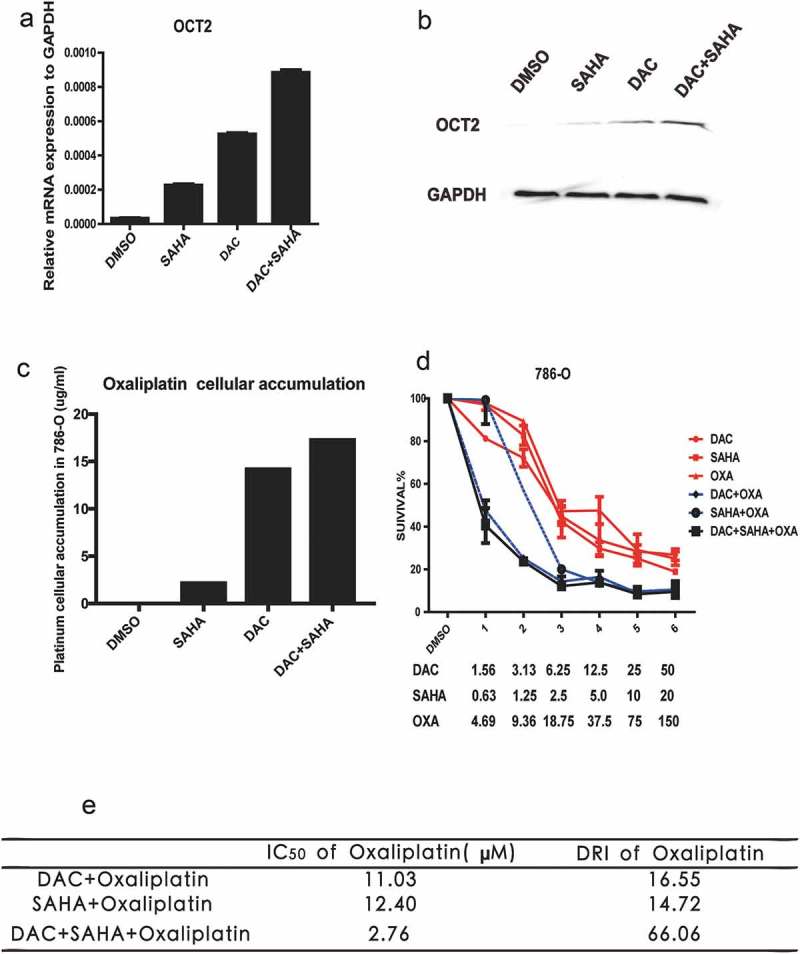
DAC, SAHA and oxaliplatin combinations. (a) RT-qPCR analysis of OCT2 mRNA expression after treated with DAC, SAHA and DAC+SAHA in 786-O cells, respectively; (b) OCT2 protein expression of DAC, SAHA, DAC+SAHA treatment in 786-O cells; (c) Platinum cellular accumulation after treated with DAC, SAHA and DAC+SAHA in 786-O; (d) Dose-Survival Curve of DAC, SAHA, OXA, DAC+SAHA, DAC+OXA, SAHA+OXA, DAC-SAHA-OXA in 786-O cells; (e) The IC50 and dose-reduction index (DRI) of OXA. DRI is the ratio of dose of OXA (alone) to dose of OXA (combo), which represents the fold-dose decrease of OXA in combination. CI < 0.8, 0.8 < CI<1, and CI > 1 indicate synergism, additive effect, and antagonism, respectively. The results are expressed as means ± S.D. from technical triplicates in a–d.