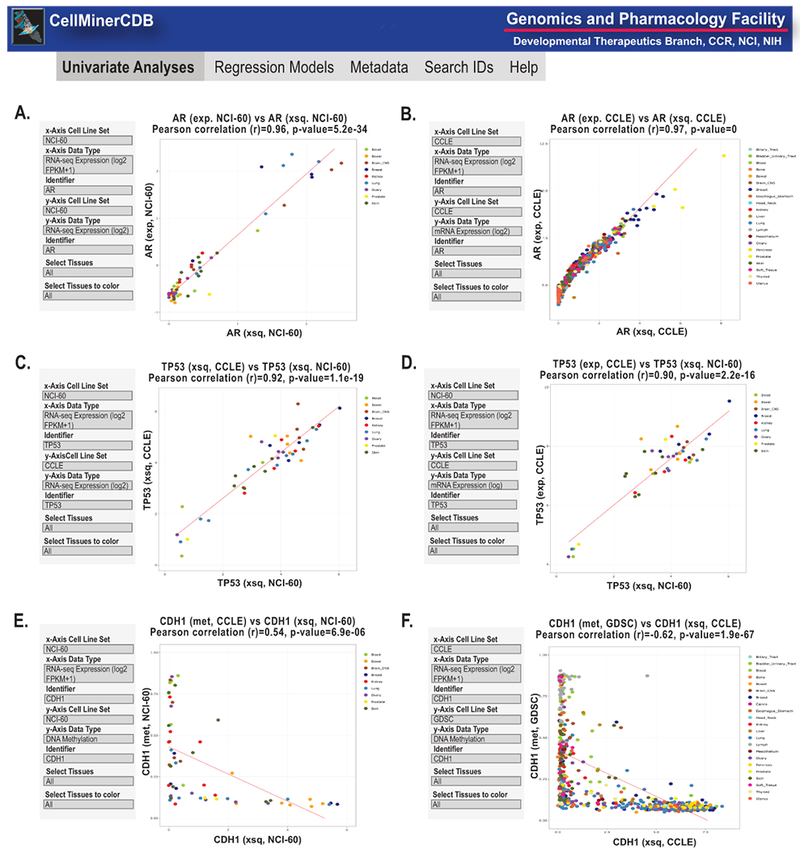
Figure 3.

Snapshot of CellMinerCDB univariate analyses2. A-B. AR (androgen receptor) transcript expression comparisons of RNA-seq (log2 FPKM + 0.1) and microarrays for the NCI-60 and CCLE. C-D. TP53 transcript expression comparisons of RNA-seq (log2 FPKM +1) and microarrays for the NCI-60 and CCLE. E-F. CDH1 (E-cadherin) comparisons of RNA-seq (log2 FPKM +1) expression and DNA methylation levels. In all panels, the input parameters are shown on the left. Each dot is a cell line, with the color code defined by the legend on the right and in CellMinerCDB2. Regression lines are included. x- and y-axes, correlations and p values are as defined within each panel. Exp. is microarray expression using z score, xsq is RNA-seq expression using log2 FPKM +1 and met is DNA methylation.
