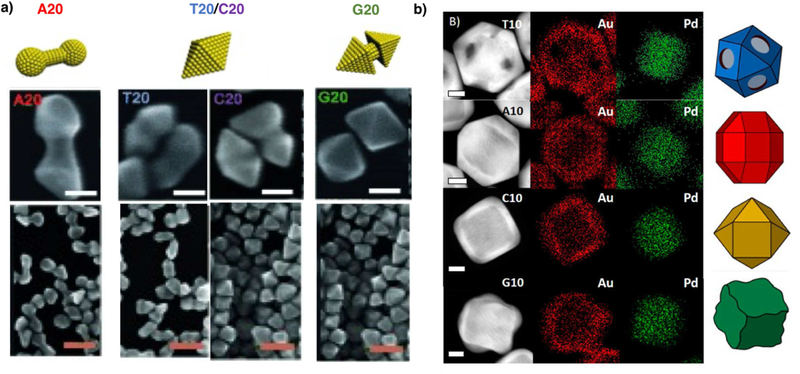
Figure 2.
Sequence-specific control of inorganic nanomaterial morphologies by DNA. a) SEM images of gold nanoparticle morphologies produced with A20, T20, C20, and G20 at different magnifications and corresponding models. Adapted with permission from reference [26**]. Copyright 2015, John Wiley and Sons. Sacle bars = 30 nm for the top row. Scale bars = 100nm for the bottom row. b) STEM and elemental mapping images of the Pd−Au nanoparticles synthesized in the presence of T10, A10, C10, and G10 and models of corresponding particles. Adapted with permission from reference [25**]. Copyright 2016 American Chemical Society. Scale bars = 25 nm.

