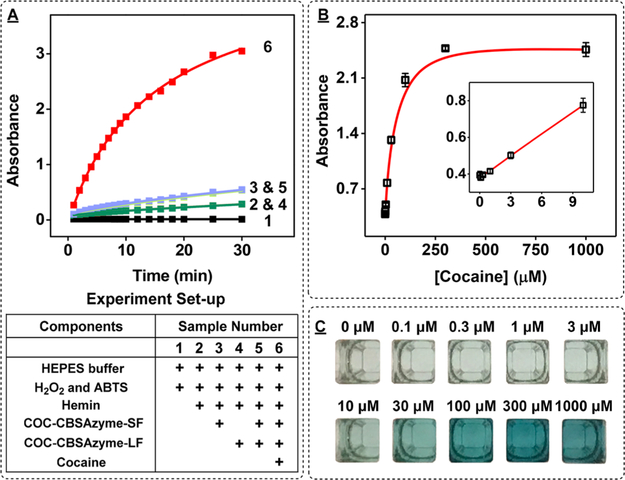
Figure 3.
Utilizing COC–CBSAzyme for the visual detection of cocaine. (A) Time-dependent absorbance change at 418 nm with (1) reaction buffer alone, (2) hemin alone, (3) short fragment with hemin, (4) long fragment with hemin, and both fragments plus hemin in the (5) absence or (6) presence of 250 μM cocaine. (B) Calibration curve generated using 0–1000 μM cocaine. Inset shows the linear range from 0 to 10 μM cocaine. (C) Photographs of samples containing 0–1000 μM cocaine after 15 min of reaction. [Each fragment] = 1 μM. For the calibration curve, error bars show standard deviation of absorbance from three measurements at each concentration.

