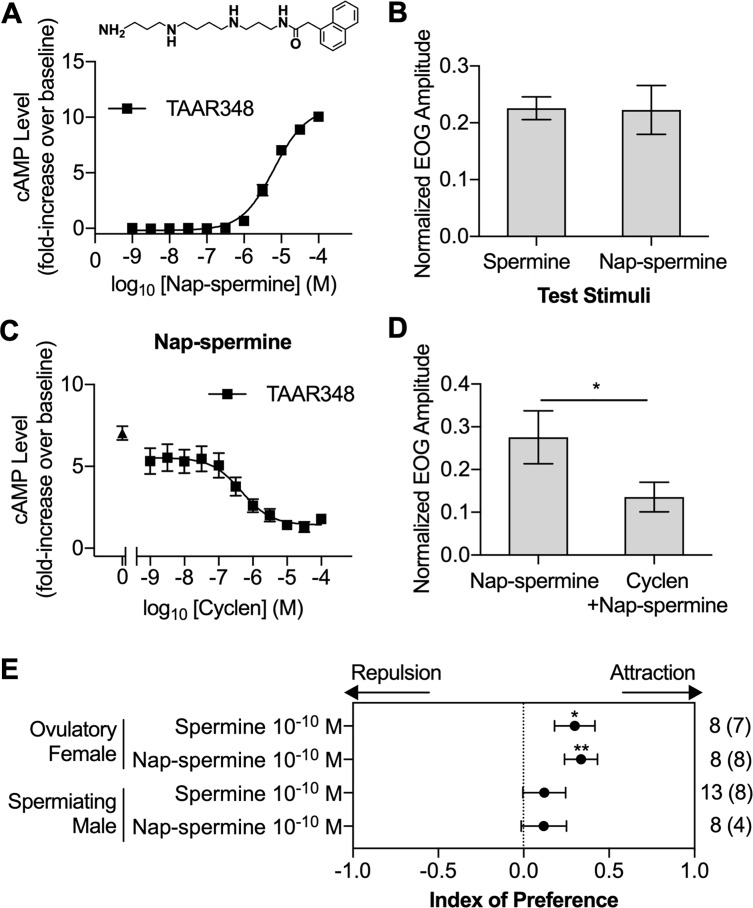
Fig 6. Nap-spermine, an agonist of spermine receptor TAAR348, induced responses virtually identical to those induced by spermine.
(A) Nap-spermine induced cAMP production in a concentration-dependent manner in TAAR348-expressing HEK293T cells (mean ± SEM, n = 5). The cAMP assay was done as in Fig 3B. (Inset) Structure of nap-spermine. (B) EOG responses to 10−7 M spermine and 10−7 M nap-spermine (mean ± SEM, n = 12 and n = 6, respectively). Normalized EOG responses were blank-subtracted and normalized to the amplitude of the responses to 10−5 M L-arginine. (C) Cyclen inhibited cAMP production induced by 10−5 M nap-spermine in HEK293T cells with TAAR348. The filled triangle represents the cAMP production induced by TAAR348-expressing HEK293T cells exposed to only 10−5 M nap-spermine (mean ± SEM, n = 5). (D) Cyclen treatment (10−5 M) reduced the EOG response magnitude to nap-spermine (10−6 M). Cyclen exposure conditions are the same as in Fig 5A. EOG responses were blank-subtracted and normalized to the amplitude of the responses to 10−5 M L-arginine (mean ± SEM, n = 5). (E) Adult sea lamprey behavioral responses to spermine and nap-spermine in a two-choice maze (S2 Fig). For definition of the index of preference, see Materials and methods. A positive index value indicates attraction, and a negative index value indicates repulsion. Significance was evaluated using a Wilcoxon signed-rank test. The number in the parentheses indicates the number of test subjects spending more time in the experimental channel out of the total sample size. *p < 0.05, **p < 0.01. Underlying data are available in S1 Data. cAMP, cyclic-adenosine monophosphate; EOG, electro-olfactogram; HEK293T, human embryonic kidney 293T; nap-spermine, 1-naphthylacetyl spermine; TAAR, trace amine-associated receptor.

