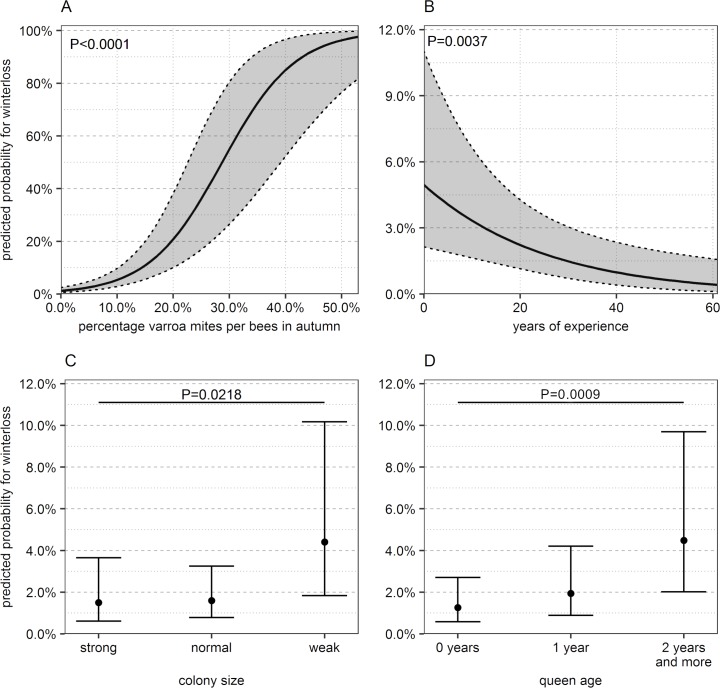
Fig 4. Marginal effects of probability for winter loss as predicted by the GLMM.
Probability is shown for the four significant factors (A) varroa mite infestation level in autumn, (B) years of beekeeping experience, (C) estimated colony size in autumn and (D) age of the queen in autumn. For each graph the remaining co-variates are set to the mean. For detailed model see Table 4. Please note the different scales of the y-axis. n = 1382 colonies, N = 188 apiaries. Gray shadings, error bars: 95%CI.

