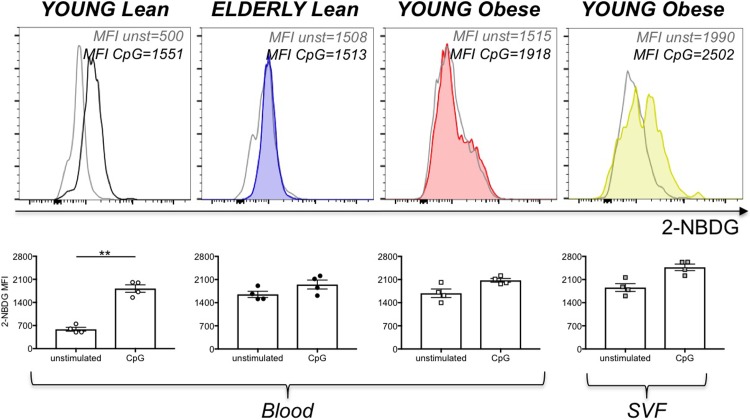
Fig 6. Effects of aging and obesity on glucose uptake in DN B cells.
PBMC from the blood from young and elderly lean individuals and from the blood of young obese individuals were stained to evaluate the frequencies of DN B cells. The SVF from the SAT of young obese individuals was also stained. Young individuals giving PBMC and the SAT were age-, gender- and BMI-matched. Cells were incubated in the presence of 2-NBDG. Top. Representative histograms of 2-NBDG uptake are shown for each group of individuals. Bottom. Mean Fluorescence Intensity (MFI)±SE of 2-NBDG uptake before and after CpG stimulation. Mean comparisons between groups were performed by Student’s t test (two-tailed). **p<0.01.

