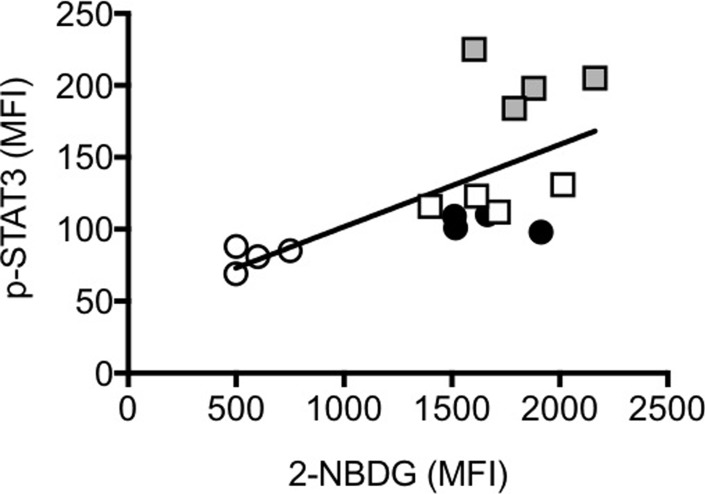
Fig 8. Glucose uptake is positively associated with ic phospho-STAT3 in DN B cells.
PBMC and SVF were obtained as indicated previously. Glucose uptake and ic phosphor-STAT3 were measured in DN B cells from the same individuals. Pearson’s correlation r = -0.65, p = 0.007. Symbols are as follows: young lean, white circles; elderly lean: black circles; young obese: white squares; young obese SVF: grey squares.

