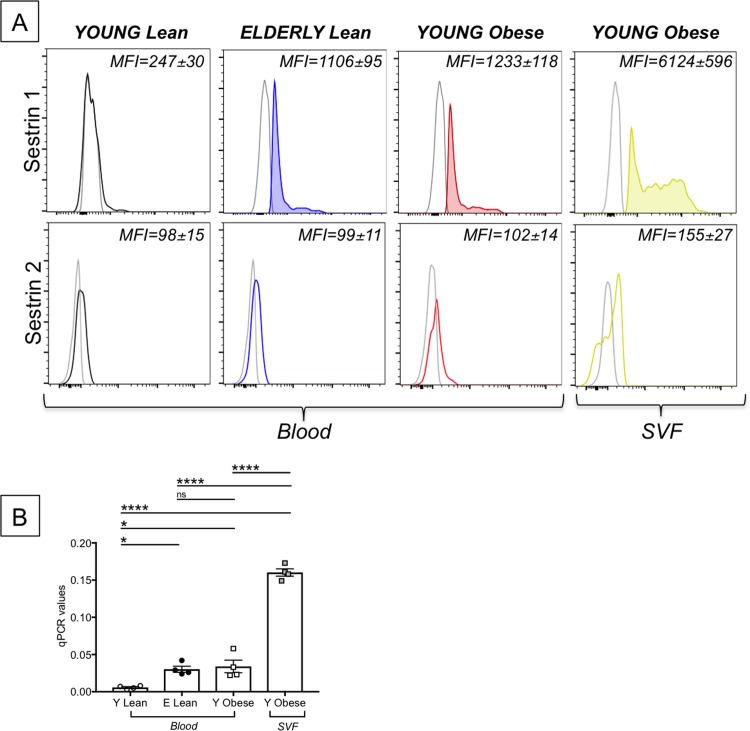
Fig 10. Effects of aging and obesity on Sestrin 1 and Sestrin 2.
PBMC and SVF were obtained as indicated previously (n = 4). A. Results show mRNA expression of Sestrin 1 (top) and Sestrin 2 (bottom), both measured by PrimeFlow. B. qPCR values (2-ΔΔCt) of Sestrin 1. Mean comparisons between groups were performed by two-way ANOVA. *p<0.05, ****p<0.0001, ns: not significant.

