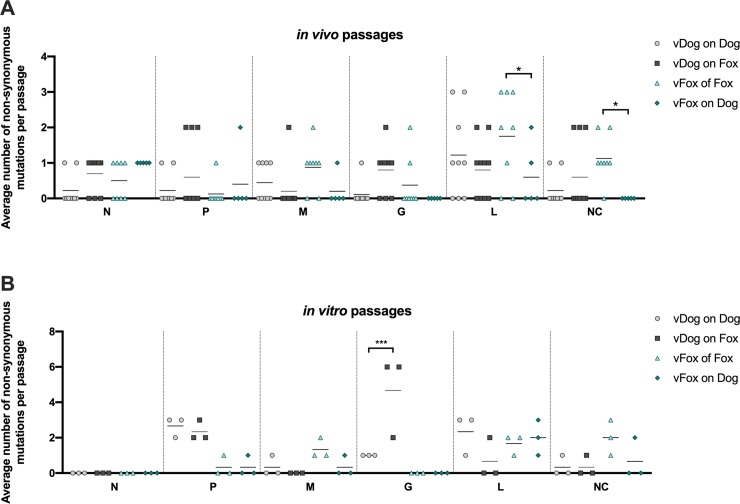
Fig 2. Distribution of non-synonymous mutations across the RABV genome.
The number of non-synonymous mutations were examined in each region of RABV genome (N, P, M, G and L genes and the non-coding (NC) regions) and are represented by a dot plot. The average number of mutations were assessed per region and per animal for in vivo passages (A) or per cell culture for in vitro passages (B). Statistical analysis (Tukey’s multiple comparison test) was performed using GraphPad Prism software. * P < 0.01; *** P < 0.0001. Error bars correspond to standard deviations.

