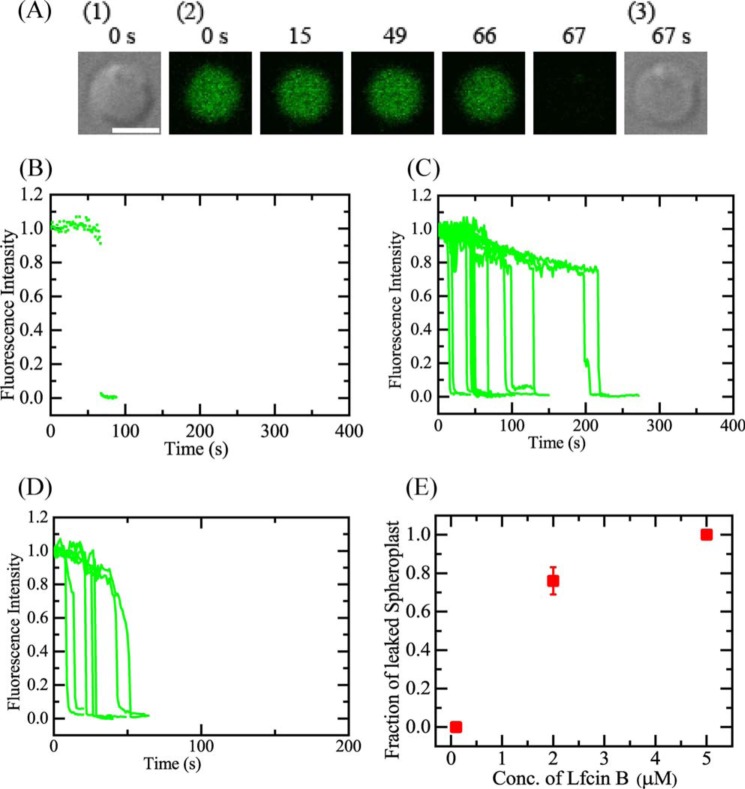
Figure 3.
Interactions of LfcinB with single spheroplasts containing calcein. A, CLSM images due to calcein (images with green color) (2) and DIC images (1 and 3). The number above each image shows the time in seconds after the addition of 2.0 μm LfcinB was started. The bar is 5.0 μm. B, the time course of change in the normalized FI of the total spheroplast due to calcein during the interaction of 2.0 μm LfcinB at 25 °C shown in A. We obtained the normalized FI of a spheroplast as the ratio of the FI at time t to that before the addition of LfcinB. The addition of LfcinB was started at t = 0. C, other examples of the time course of the change in the normalized FI of several spheroplasts under the same experimental conditions as in A. D, the time course of change in the normalized FI of the spheroplasts due to calcein during the interaction of 5.0 μm LfcinB. In C and D, each curve corresponds to the time course of FI of each spheroplast. E, LfcinB concentration dependence of the fraction of leaked spheroplasts (red ■). Mean ± S.D. of the fraction of leaked spheroplasts are shown.

