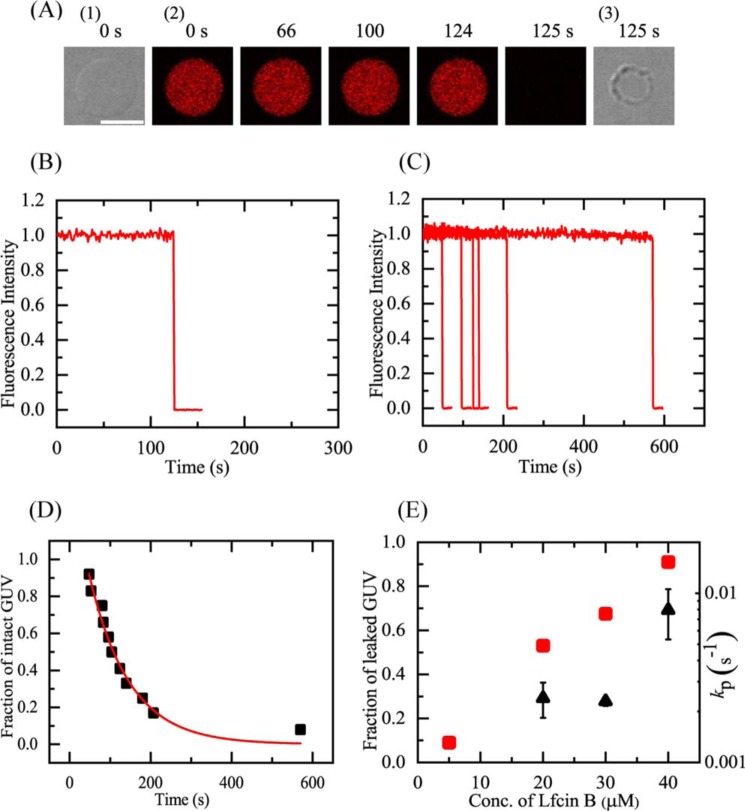
Figure 5.
LfcinB-induced leakage of AF647 from single E. coli-lipid-GUVs. A, leakage of AF647 from single E. coli-lipid-GUVs induced by 40 μm LfcinB in buffer C at 25 °C. CLSM images (2) show that the AF647 concentration inside the GUV rapidly decreased after some lag time of the addition of LfcinB. The numbers above each image show the time in seconds after the LfcinB addition was started. Also shown are DIC images of the GUV at time 0 (1) and 125 s (3). The bar corresponds to 20 μm. B, time course of the change in the normalized FI of the GUV shown in A. We obtained the normalized FI of a GUV as the ratio of the FI at time t to that before the addition of LfcinB. C, other examples of the time course of the change in the normalized FI of several single GUVs under the same conditions as in A. Each curve corresponds to the time course of each GUV. D, time course of fraction of intact GUV, Pintact, among all examined GUVs. The solid line represents the best fit curve of Equation 1. E, LfcinB concentration dependence of the rate constant of local rupture, kP (▴), and fraction of leaked GUV at 10 min (red ■). Mean ± S.D. of these values are shown.

