Figure 5.
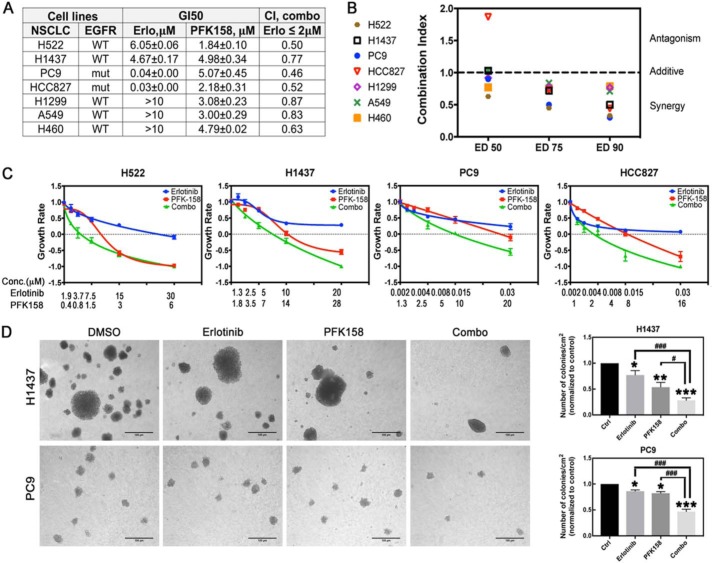
PFK158 synergizes with erlotinib in WT and mutEGFR cell lines. A, WT-EGFR (H522, H1437, H1299, H460, A549) and mutEGFR (PC9, HCC827) cells were exposed to either erlotinib, PFK158, or the combination for 48 h. Cell viability was evaluated by trypan blue exclusion and used to determine the GI50 (drug concentration that causes 50% growth inhibition) relative to the vehicle control cells. Combination index for drug combination with erlotinib ≤2 μm was calculated using the CalcuSyn program based on the Chou-Talalay method. Mean ± S.D. of three independent experiments (n = 6). B, combination index at various effective doses (ED) for the constant drug ratio for different NSCLCs lines was calculated. Data shown are from a representative experiment. C, NSCLC cells were treated with PFK158 and erlotinib as single drugs or in combination at the indicated concentrations for 48 h. Cell viability was evaluated by trypan blue exclusion experiments. Data are plotted as growth rate values as indicated in methods, where GR >0 indicates inhibited growth, GR = 0, cytostatic effect and GR <0, cytotoxic effect. Error bars, mean ± S.E. of three independent experiments (n = 6). D, H1437 cells were seeded in soft-agar plates and exposed to 0.45 μm erlotinib and 0.62 μm PFK158 alone or in combination for 15 days. PC9 cells were seeded in soft-agar plates and exposed to 3.12 nm erlotinib and 0.31 μm PFK158 alone or in combination for 10 days. Left panel, representative images of formed colonies are shown (20× magnification). Scale bar, 100 μm. Right panel, numbers of colonies/cm2 normalized to vehicle-treated cells. Error bars, mean ± S.E. of three independent experiments (n = 18). p values are shown as follows: *, <0.05; **, <0.01; and ***, <0.001 (compared with vehicle treatment). #, p < 0.05; ###, p < 0.001, compared with indicated drug treatment.

