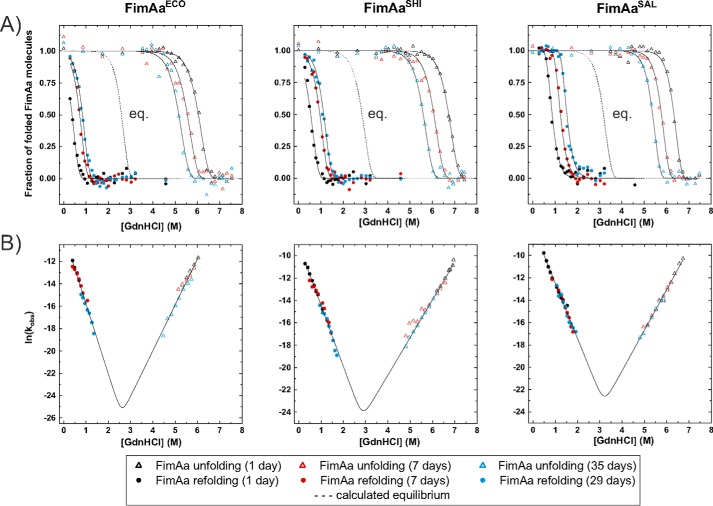
Figure 4.
Nonequilibrium unfolding and refolding transitions at pH 7.0 and 25 °C of FimAa variants. A, unfolding and refolding transitions (triangles and circles, respectively) were recorded via the far-UV CD signal at 230 nm after incubation for 1 day (black), 7 days (red), and 35 days (blue). The final protein concentration was 10 μm in all experiments. The three data sets for unfolding and the three datasets for refolding recorded for each FimAa variant were fitted globally (solid lines) according to an unattained two-state equilibrium model and normalized (see “Materials and methods”). The equilibrium transitions calculated according to Equation 6 are indicated with dotted lines. B, V-plots of the logarithm of the observed rate constant of folding/unfolding (kobs) versus GdnHCl concentration for all FimAa constructs. Data points from the transition regions in A where the fraction of folded molecules was in the range of 0.05–0.95 were converted to first-order rate constants. Data were fitted according to the two-state model of folding (Equation 5, solid lines). The deduced values of ΔG0, the rate constants of folding and unfolding in the absence of denaturant (kFH2O and kUH2O), and the kinetic m-values (mU and mF) are listed in Table 2.

