
Figure 3.
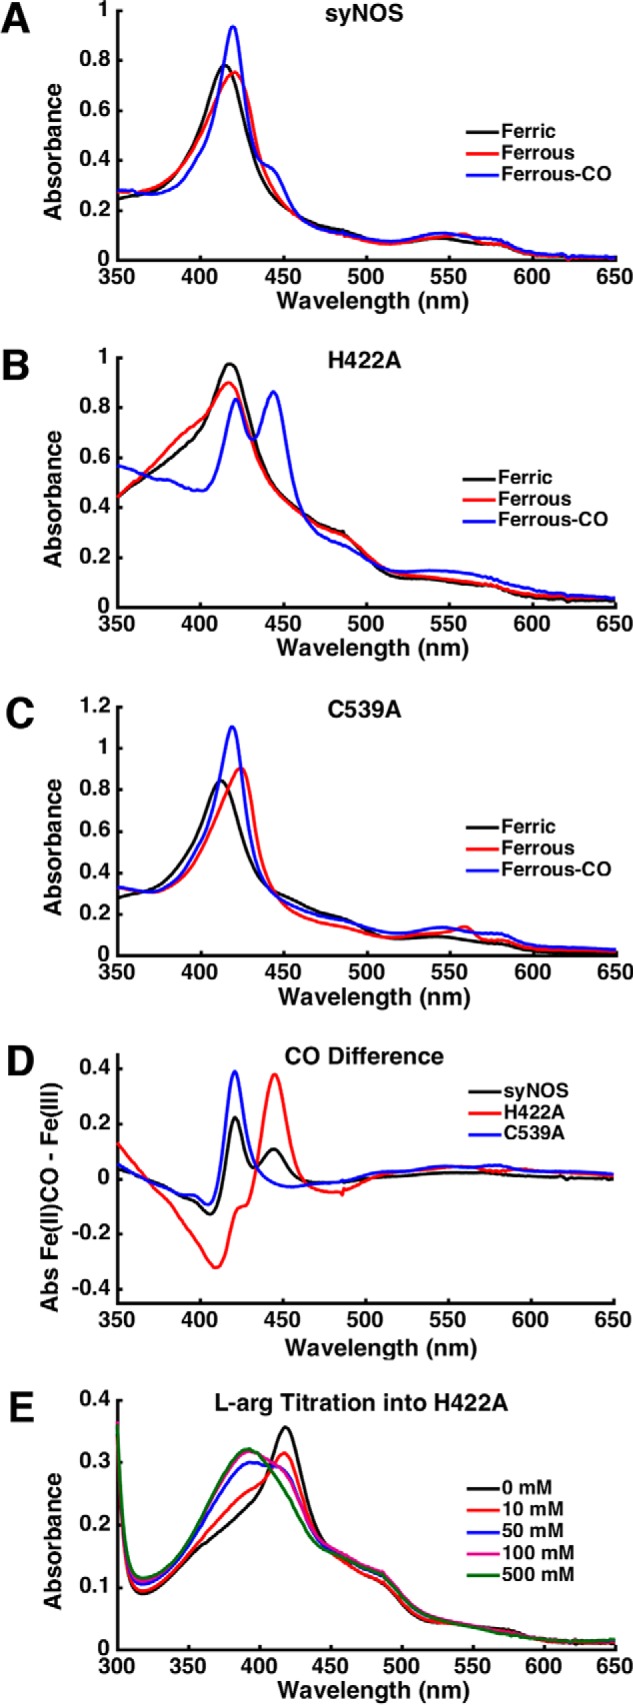
A–C, UV-visible spectra of WT syNOS (A), H422A (B), and C539A (C) in the ferric (black), ferrous (red), or ferrous-CO (blue) state. Samples were purged with argon before reduction with dithionite. D, difference spectrum of the ferrous-CO minus the ferric form of syNOS (black), H422A (red), and C539A (blue). E, arginine titration into H422A.