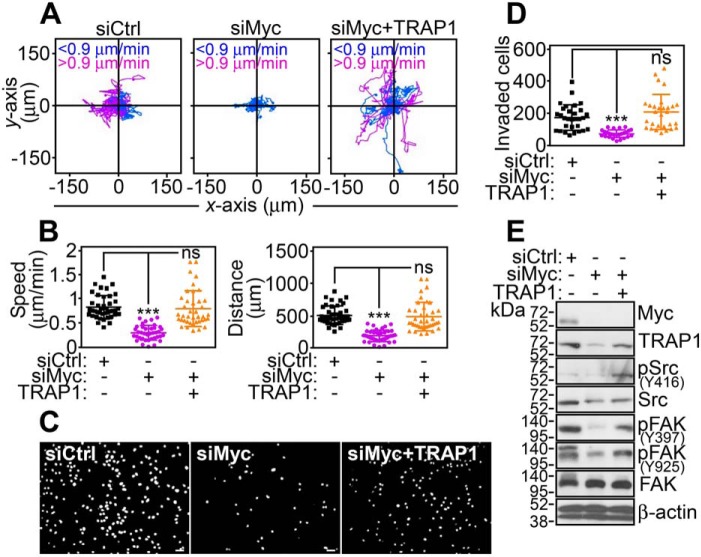
Figure 3.
Myc–TRAP1 regulation of tumor cell motility. A, PC3 cells transfected with siCtrl or siMyc were reconstituted with TRAP1 cDNA and analyzed for 2D cell motility by time-lapse video microscopy. Each tracing corresponds to the movements of an individual cell (n = 19–20). The cutoff velocities for slow (<0.9 μm/min)- or fast (>0.9 μm/min)-moving cells are indicated. The siCtrl panel is the same as siCtrl in Fig. S6A. B, conditions are as in A, and PC3 cells were analyzed for speed of cell movements (left panel) or total distance traveled by individual cells (right panel). Each symbol corresponds to an individual determination (n = 38–41). ***, p < 0.0001; ns, not significant. C and D, conditions are as in A, and transfected PC3 cells were analyzed for invasion across Matrigel-coated inserts (C, representative images of 4′,6-diamidino-2-phenylindole–stained nuclei of invaded cells) and quantified (D). Each symbol corresponds to an individual determination (siCtrl, n = 30; siMyc, n = 26; siMyc + TRAP1, n = 29). The siCtrl panel is the same as siCtrl in Fig. S6C. Scale bars, 50 μm. Mean ± S.D. ***, p < 0.0001; ns, not significant. E, conditions are as in A, and transfected PC3 cells were analyzed by Western blotting.

