Figure 4.
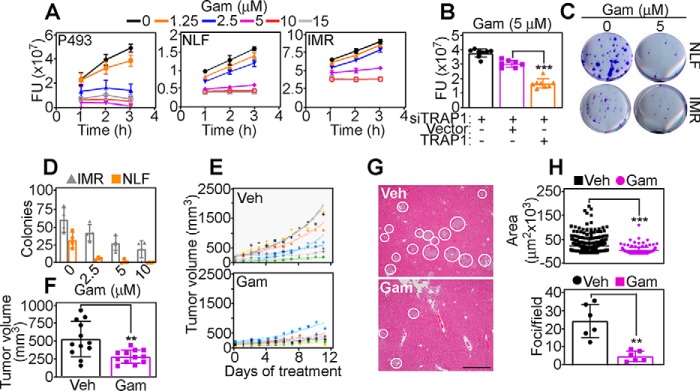
Myc–TRAP1 signaling promotes primary and metastatic tumor growth. A, P493, NLF, or IMR cells were incubated with increasing concentrations of Gamitrinib (Gam) and analyzed for cell viability after the indicated time intervals. FU, fluorescence units. Mean ± S.D. (n = 3). B, IMR cells were transfected with TRAP1-directed siRNA, reconstituted with vector or TRAP1, and analyzed for cell viability in the presence of Gamitrinib. Mean ± S.D. (n = 8). ***, p < 0.0001. C and D, NLF or IMR cells were treated with the indicated concentrations of Gamitrinib and analyzed for colony formation (B, representative images) and quantified (C). Mean ± S.D. (n = 3). E, P493 cells were engrafted s.c. in athymic nude mice, and randomized animal groups were treated with vehicle (Veh) or Gamitrinib (10 mg/kg/daily/i.p.) with quantification of tumor growth at the indicated time intervals. Trend lines correspond to an individual tumor. F, conditions are as in E, and tumor growth in the indicated animal groups was quantified after 12 days of treatment. Mean ± S.E. (n = 12). **, p = 0.003. G, immunocompromised mice injected with PC3 cells into the spleen were treated with vehicle or Gamitrinib (10 mg/kg/daily/i.p.), and metastatic foci in the liver were analyzed by H&E staining after 11 days. White circles, metastatic foci. Representative images are shown. Scale bar, 500 μm. H, conditions are as in G, and the surface area (top panel) and number (bottom panel) of liver metastases in each treatment group were quantified (top, n = 156–344; bottom, n = 4–7). Mean ± S.D.**, p = 0.002; ***, p < 0.0001.

