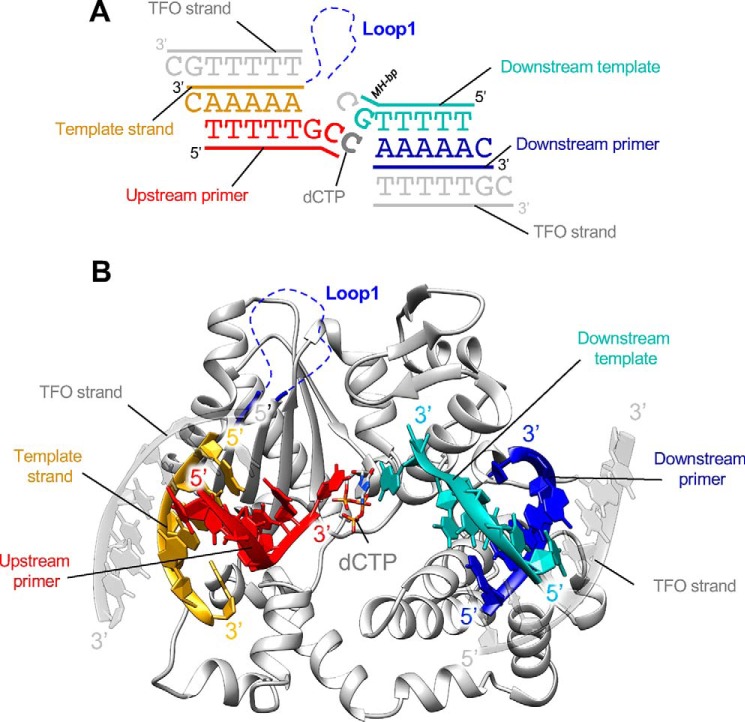
Figure 8.
Structure of TdT chimera bound to the full DNA synapsis and incoming dNTP. A, DNA substrates; the downstream DNA duplex is colored in blue and cyan, and the upstream duplex is in red and yellow (primer strand and template strand). Incoming nucleotide and Loop1 are represented in gray and blue, respectively. The two additional DNA strands, a triplex-forming oligonucleotide (TFO), are represented in gray. B, overall structure of TdT-μ chimera full DNA synapsis complex. The incoming dCTP makes Watson–Crick interactions with in trans template strand. Loop1 is mostly invisible in the electron density map and represented by blue dashed lines.

