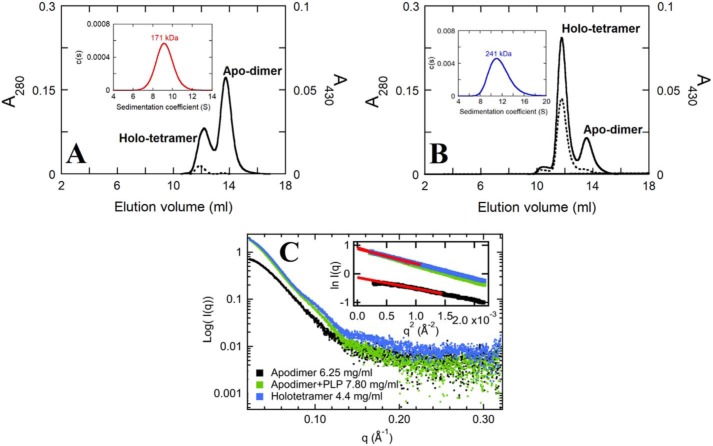
Figure 3.
Effects of PLP on oligomerization equilibrium shift. The SEC elution profiles of 20 μm apo-dimer solution in no additional PLP (A) and 100 μm PLP (B), monitored at 280 (solid line) and 430 (dashed line) nm. Insets of A and B show the plots of c(s) distribution versus S value from AUC scans at 430 nm. The observed MWs are 171 and 241 kDa for the samples obtained from A and B. C, SAXS X-ray scattering patterns of apo-dimer (6.25 mg/ml; black), PLP-added apo-dimer (7.8 mg/ml, 5× PLP excess; green), and holo-tetramer (4.4 mg/ml; blue) of hcSHMT/Δflap. The linear fits (red lines) of Guinier analysis of these protein samples are shown in the inset of C accordingly.

