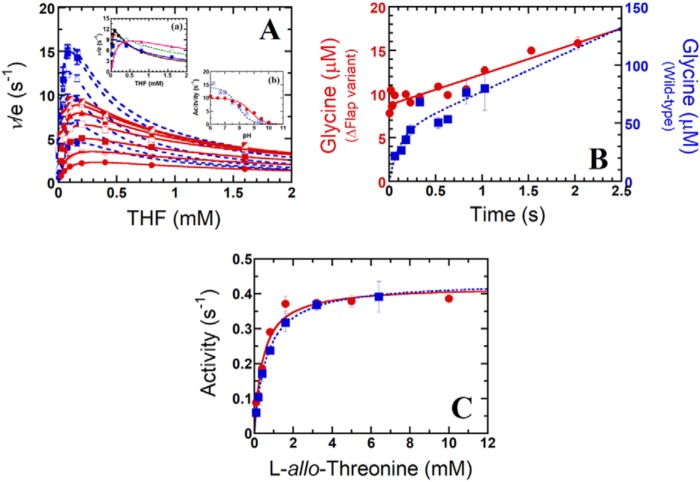
Figure 5.
Kinetic studies of the hcSHMT/Δflap reactions. A, two-substrate steady-state kinetics of hcSHMT/Δflap (red) and WT enzyme (blue) reactions at pH 7.5. The plot of ν/e versus THF concentrations (0.025–1.6 mm for hcSHMT/Δflap and 0.005–0.16 mm for WT) at fixed l-serine concentrations (0.1–6.4 mm for hcSHMT/Δflap and 0.1–3.2 mm for WT) is shown. Each fit curve represents low to high concentrations of l-serine with relative increasing velocity. Inset a of A, the apparent kinetics of the hcSHMT/Δflap at pHs 6.5–8.5 using 0.025–1.6 mm THF and 6.4 mm l-serine. Inset b of A, pH-activity profile (pH 6–10) of hcSHMT/Δflap (red filled circles) and WT enzyme (blue filled squares). B, kinetics of glycine product formation of hcSHMT/Δflap (red filled circles) and WT enzyme (blue filled squares) at pH 7.0. C, THF-independent aldol cleavage of l-allo-threonine (0.1–10 mm) of hcSHMT/Δflap (red filled circles) and WT (blue filled squares) enzymes measured by an SHMT–ADH coupled assay. Error bars represent S.D. (or S.E.).

