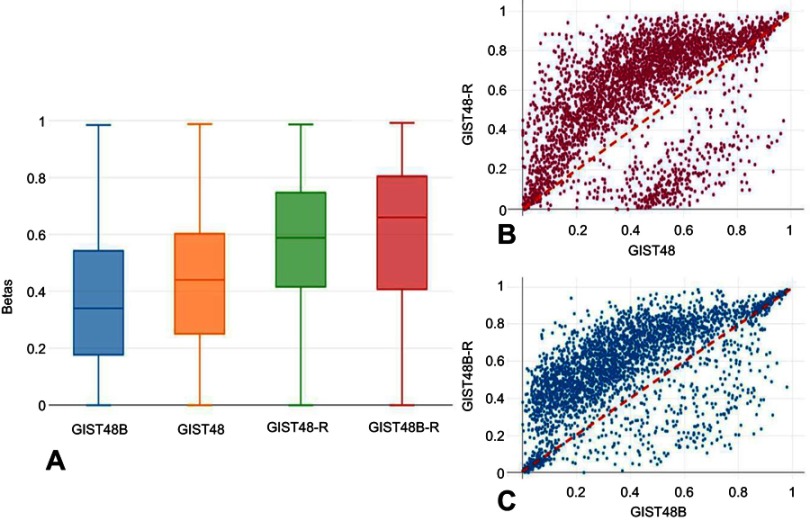
Figure 5.
Global methylation profile.
Notes: (A) Box plots showing the β-values of CpGs islands at promoters only . General hypermethylation was more common in the BYL719-resistant cell lines. (B, C) Scatterplots of genome-wide DNA methylation levels (β). To highlight general hypermethylation, CpG islands with Δβ<–0.2 or >0.2 are shown.

