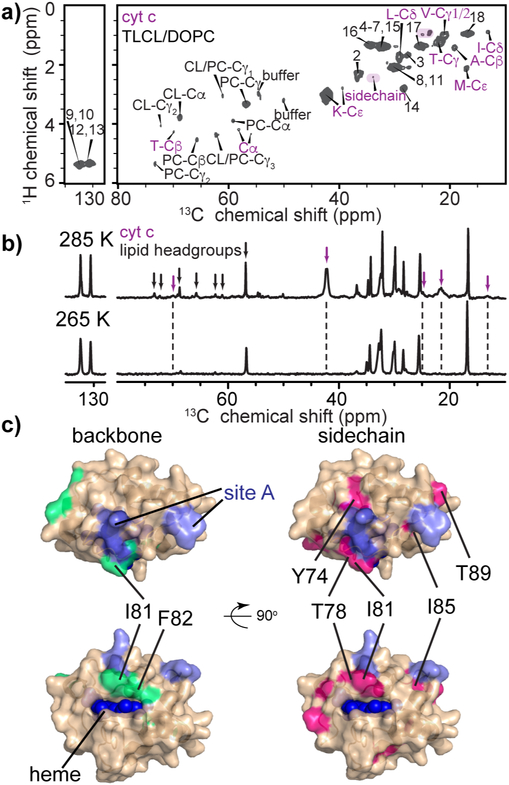
Figure 5. PUFA CL and its impact on cyt c dynamics.
(a) INEPT-based ssNMR 2D spectrum of U-13C,15N-labeled cyt c bound to TLCL/DOPC (1:1) vesicles, P/L ratio 1:25, with protein peaks highlighted in purple labels. The spectrum was acquired at 14.1 T, 285 K, and MAS rate of 10 kHz. (b) INEPT-based 1D 13C spectra of TLCL/DOPC (1:1) vesicles with U-13C,15N-labeled cyt c bound, acquired at 285 K and 265 K at 14.1 T and 10 kHz. Cyt c and lipid headgroup signals are marked in the spectra with purple and black arrows, respectively, with unmarked peaks being due to lipid acyl chains. The protein and lipid headgroup signals are missing in the spectrum at 265 K, whereas lipid acyl chain signals are retained. (c) Lipid-dependent perturbations in cyt c backbone (green) and sidechain (pink) comparing binding to TLCL/DOPC (1:1) LUVs, to TOCL/DOPC membrane binding. Site A and heme are marked. Refer also to Figure S5 and S6.

