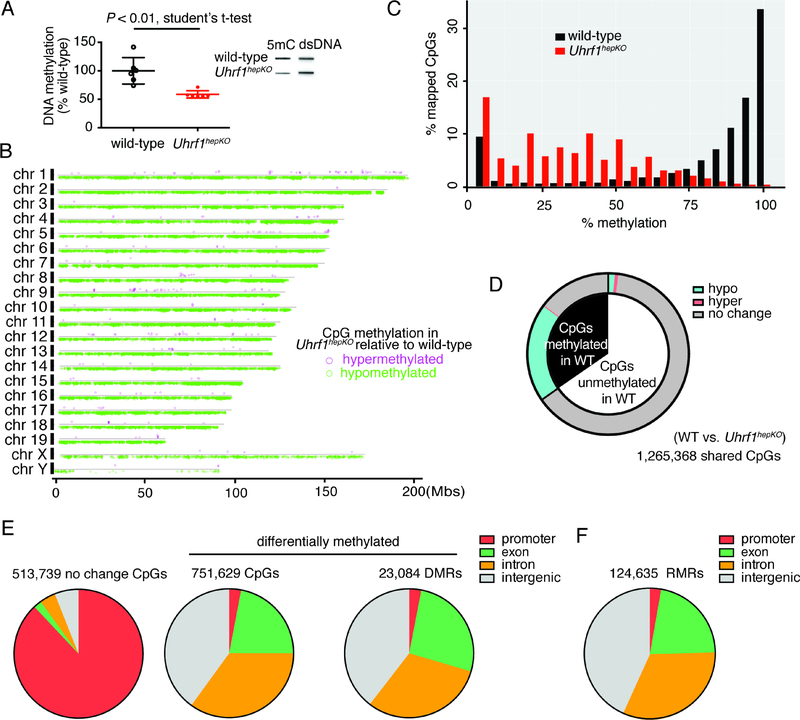
Figure 3: Uhrf1hepKO mouse livers display genome-wide loss of DNA methylation in non-promoter regions.
(A) Bulk DNA methylation levels in control and Uhrf1hepKO quiescent livers as determined by slot blot (N=6; example of one blot provided in inset). (B) Genome-wide distribution of CpGs that were hyper- (pink) or hypo-methylated (green) in Uhrf1hepKO livers compared to controls. (C) Histogram of all RRBS mapped CpGs binned by percentage methylation. (D) Distribution of CpG methylation changes in Uhrf1hepKO livers based on eRRBS analysis, comparing CpGs which were methylated >80% (black) to those that were not (white, <20%) in control livers. (E) Annotation of genomic elements based on CpGs methylation status in Uhrf1hepKO mice compared to controls. (F) Residually methylated regions (RMRs) in Uhrf1hepKO quiescent livers were distributed across the genome in a pattern similar to the DMRs.

