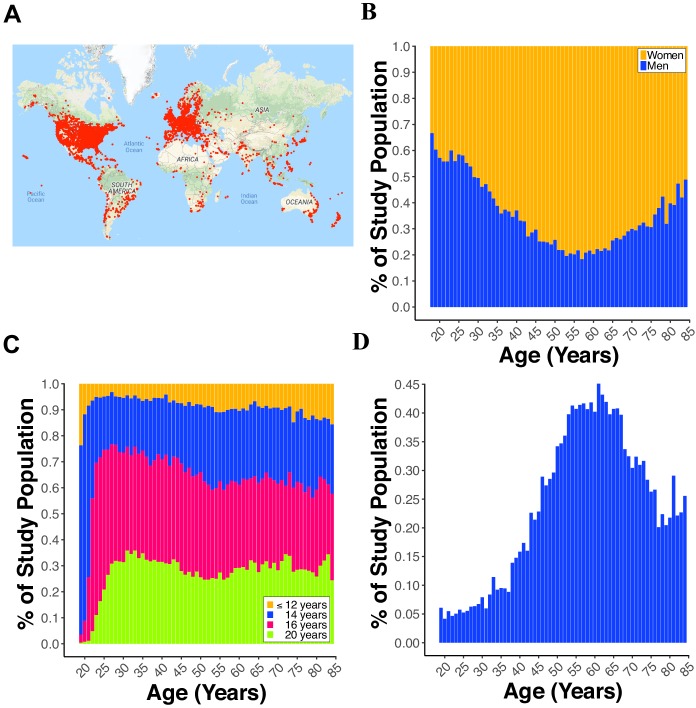
Figure 1. Demographics of participants.
(A) World map displaying a red dot (i.e., one dot = one IP address) at the location of a participant completing the paired-associates learning (PAL) task. (B) Line plot showing the percent of males and females from 18 to 85 years old. (C) Line plot displaying the percent of participants with 12, 14, 16, or 20 years of education for each year of age from 18 to 85 years old. (D) Line plot showing the percent of participants reporting a first-degree family history of Alzheimer’s disease (FH) for each year of age from 18 to 85 years old.


