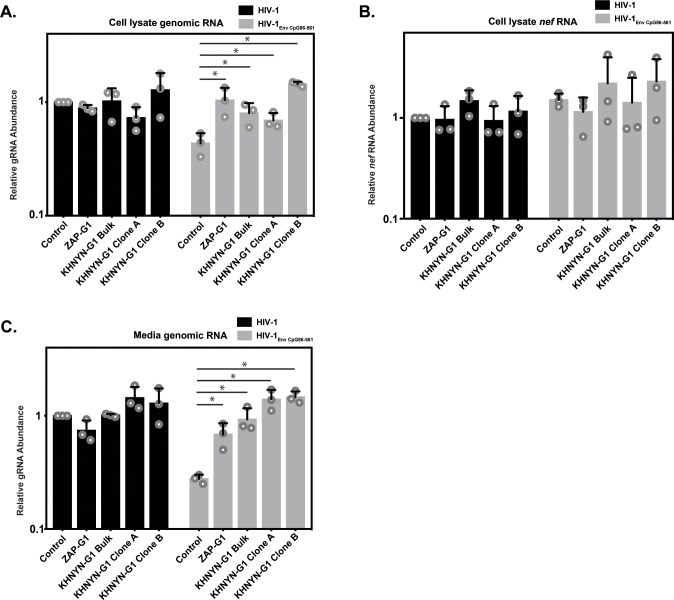
Figure 8. KHNYN is necessary for CpG dinucleotides to inhibit HIV-1 genomic RNA expression.
(A–C) HeLa Control CRISPR cells, ZAP-G1 CRISPR cells, KHNYN-G1 CRISPR bulk cells or two independent clones were transfected with 500 ng pHIV-1 or pHIV-1EnvCpG86-561 and 500 ng pGFP-FLAG. RNA was extracted from cell lysates (A–B) and media (C). Genomic RNA (gRNA) (A, C) or nef mRNA (B) abundance was quantified by qRT-PCR. The bar charts show the average value of three independent experiments normalized to the value obtained for HeLa Control CRISPR cells co-transfected with pHIV-1 and pGFP-FLAG. Data are represented as mean ± SD. *p<0.05 as determined by a two-tailed unpaired t-test. p-values for HIV-1EnvCpG86-561 genomic RNA in Control cell versus ZAP-G1, KHNYN-G1 Bulk, KHNYN-G1 Clone A, and KHNYN-G1 Clone B CRISPR cell lysates are 2.98 × 10⁻², 3.70 × 10⁻², 4.26 × 10⁻², and 1.30 × 10⁻⁴, respectively. p-Values for HIV-1EnvCpG86-561nef mRNA in Control cell versus ZAP-G1, KHNYN-G1 Bulk, KHNYN-G1 Clone A, and KHNYN-G1 Clone B CRISPR cell lysates are 0.29, 0.54, 0.90 and 0.42, respectively. p-Values for HIV-1EnvCpG86-561 genomic RNA in Control cell versus ZAP-G1, KHNYN-G1 Bulk, KHNYN-G1 Clone A, and KHNYN-G1 Clone B CRISPR cell media are 1.65 × 10⁻², 8.64 × 10⁻³, 2.82 × 10⁻³, and 3.54 × 10⁻⁴, respectively.

