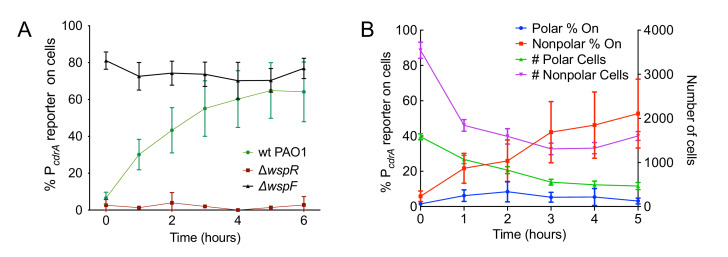
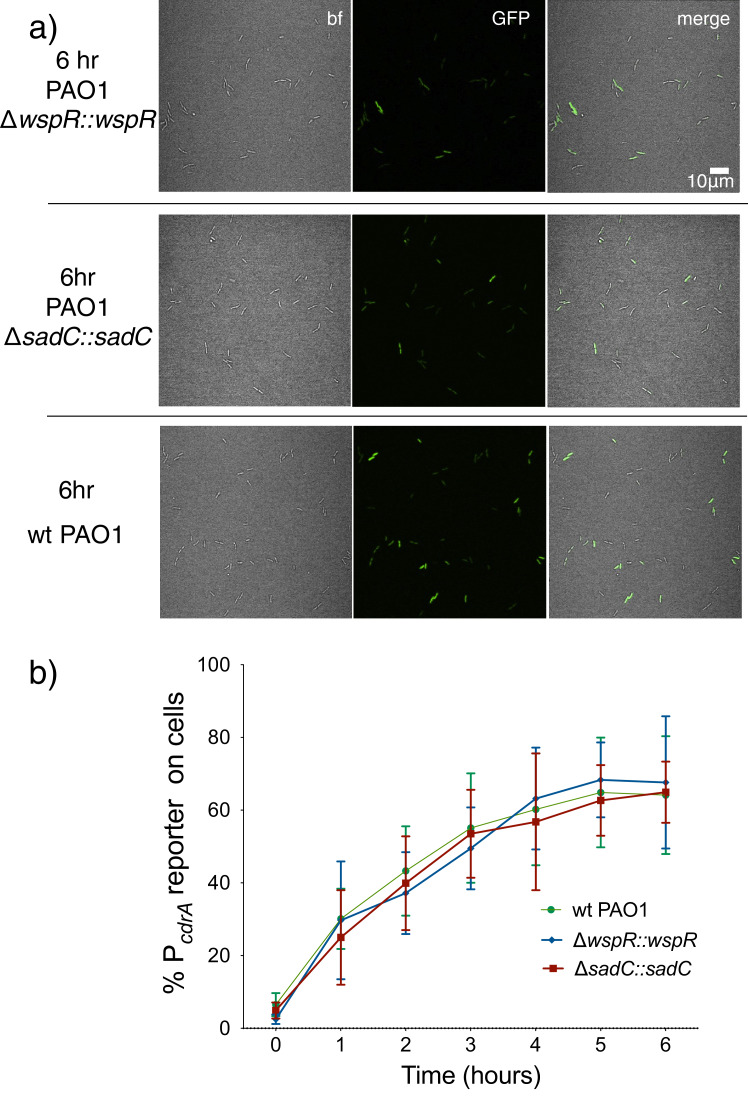
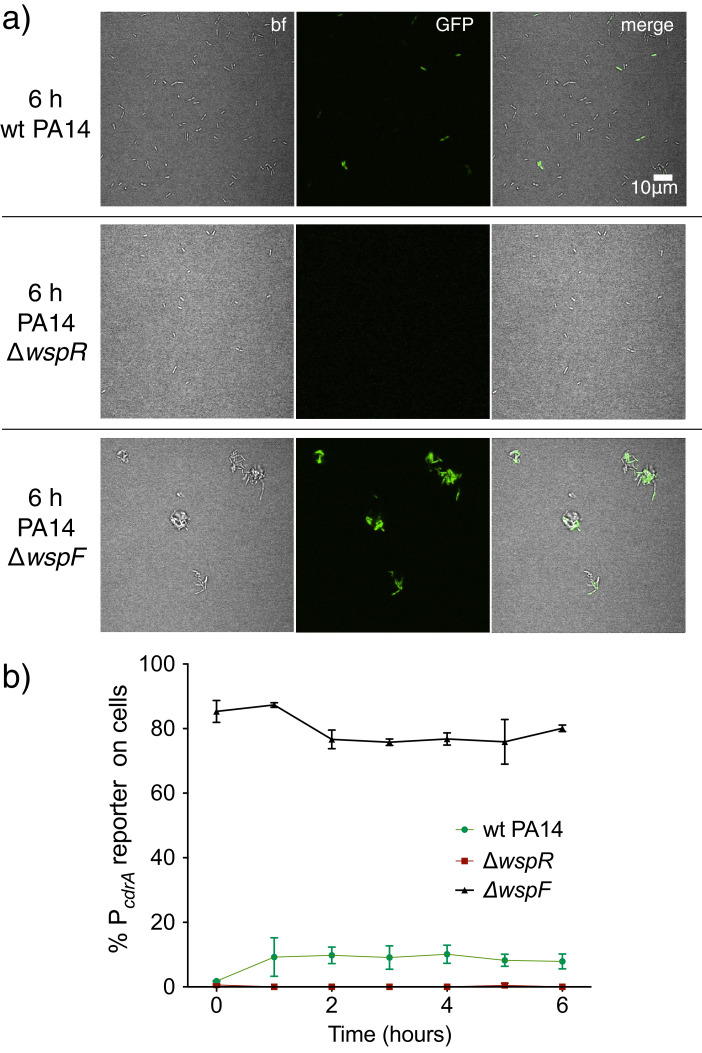
Figure 2. The Wsp system generates heterogeneity in cellular levels of c-di-GMP during early P. aeruginosa biofilm formation.
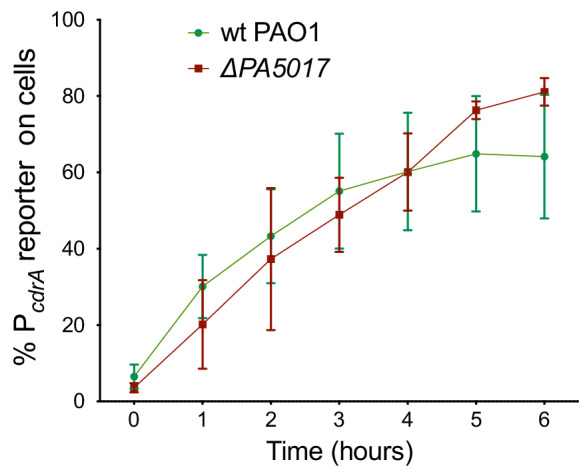
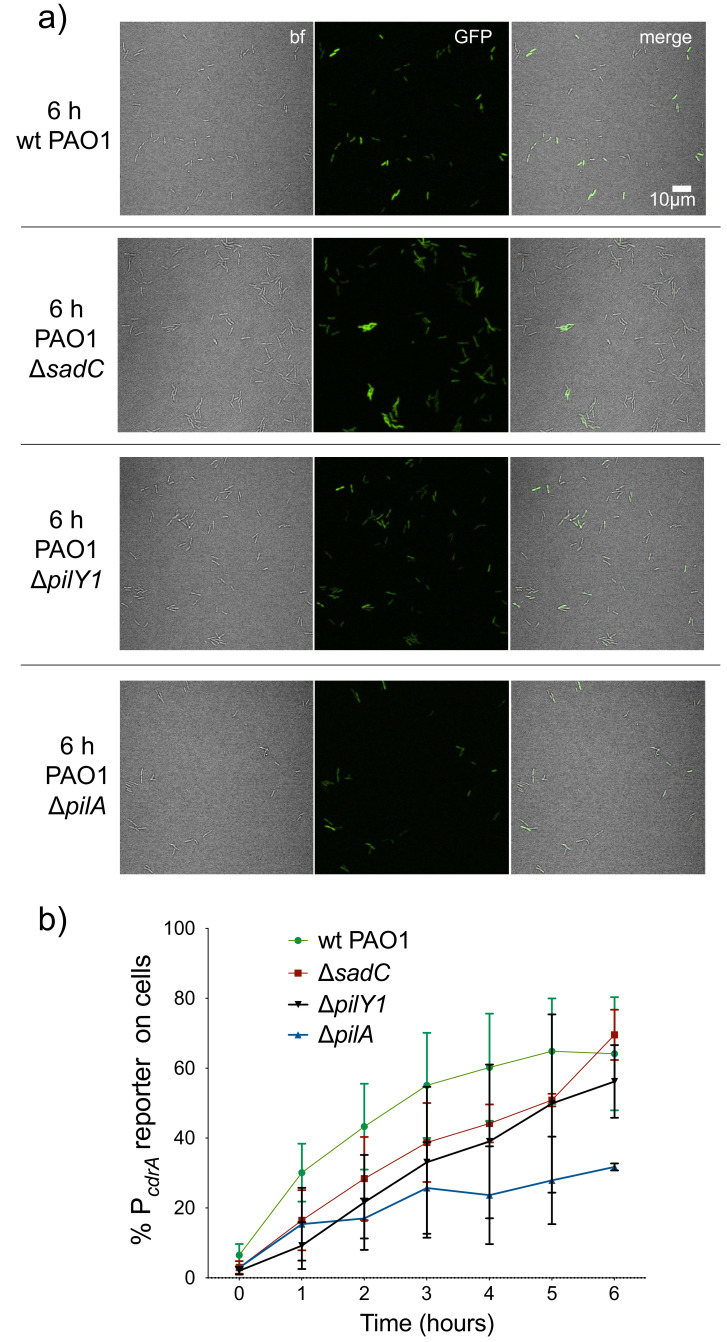
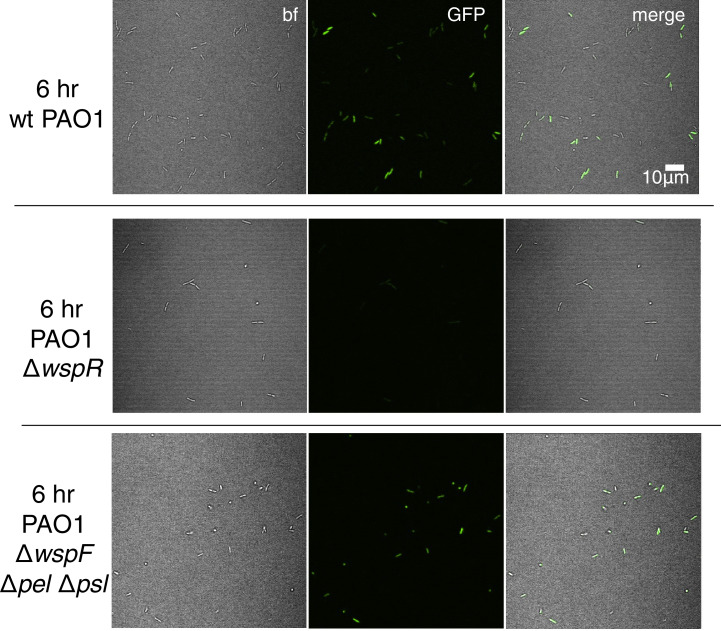
(A) The Wsp system is required for activation of the pPcdrA::gfpASV reporter during surface sensing. Six hour time course plot of the average percentage of surface-attached cells from either wild type PAO1 (green), PAO1 ΔwspR (red), or PAO1 ΔwspF (black) in which the pPcdrA::gfpASV reporter had turned ‘on’ at each hour. Cells were identified as ‘on’ if their average GFP fluorescence was greater than twice the average background GFP fluorescence of the image. Error bars = standard deviation. N ≥ 3 biological replicates. See Figure 2—figure supplement 1 for the same timecourse using mutants in the Pil-Chp surface sensing system. Figure 2—figure supplement 2 shows representative images from Figure 2A. Figure 2—figure supplement 3 shows that complementing the wspR mutant restores wild type levels of reporter activity. Figure 2—figure supplement 4 shows that the lab strain PA14 also displays Wsp-dependent c-di-GMP heterogeneity. Figure 2—figure supplement 5 shows that PA5017 (Pch) is not required for heterogeneity during surface sensing. (B) Laterally attached cells have higher c-di-GMP levels than polarly attached cells. Five hour time course plot depicting, on the left axis, the percentage of pPcdrA::gfpASV reporter ‘on’ cells that were either polarly (blue) or laterally (red) attached to the surface of a glass coverslip in a flow cell at each hour. The right axis depicts the total number of polar (green) and laterally attached (purple) cells at each time point. Cells were identified as pPcdrA:gfpASV reporter ‘on’ if their average GFP fluorescence was greater than 321 fluorescence units. Error bars = standard deviation. N = 4 biological replicates.
Figure 2—figure supplement 1. Mutants predicted to inactivate the Pil-Chp surface sensing system largely retain pPcdrA::gfpASV reporter activity during the first six hours of surface sensing.
Figure 2—figure supplement 2. The pPcdrA::gfpASV reporter is sensitive to Wsp-dependent variation in c-di-GMP during surface sensing.
Figure 2—figure supplement 3. Complemented diguanylate cyclase mutants display wild type levels of PcdrA::gfpASV reporter activity.
Figure 2—figure supplement 4. Activity of the pPcdrA::gfpASV reporter in strain PA14 is dependent on the Wsp system.
Figure 2—figure supplement 5. A mutation in PA5017 (also referred to as pch or dipA) does not impact the heterogeneity observed in surface sensing.
