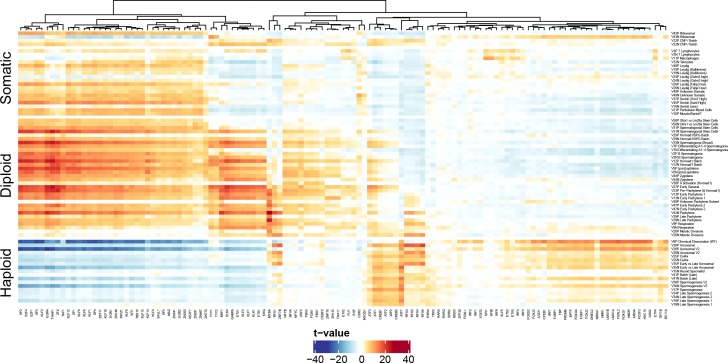
Figure 7. Components show shared cis-regulatory features.
(A) Motifs discovered from the promoter sequences of genes with high component loadings. In each motif logo pair the lower logo shows the de novo inferred motif and the upper logo shows the motif in the HOCOMOCO database best matching the de novo motif. Orange ‘T’ indicates this transcription factor is highest expressed in testis in the GTEx database (half T indicates second highest). Green ‘I’ indicates that a mouse knockout of this gene is infertile. Blue ‘L’ indicates a mouse knockout of this gene is embryonic lethal. Red ‘M’ indicates this gene is required for macrophage development. The notation ‘Crem-t (Atf1)’ indicates that we suspect that the true transcription factor recognizing the motif is not the closest matching database-motif (Atf1). * the (upper) STRA8 motif shown is from Kojima et al., rather than the HOCOMOCO database (B) Association of gene loadings with the probability each de novo identified motif is found in the genes for each component. Coloring is a Z-score from a correlation test between gene loadings and motif probabilities,where red (blue) indicates positive (negative) association. The germ cell components (rows) are ordered by pseudotime. The correlation was calculated for positive and negative parts of the component separately and in the cases where the component is mainly one-sided the other side has been omitted, as have the single cell components. The additional column ‘CpG’ shows the same association test, but with count of promoter CpG dinucleotides, for each component. Across the top of the panel, color bars indicate the maximum probability of there being a CpG at any one position in the denovo motif, and whether that probability is greater than 0.3. See Figure 7—figure supplement 2 for an analogous plot using the HOCOMOCO motif probabilities. We find high and specific enrichment of ChIP-seq targets of STRA8, MYBL1, RFX2 and CREM in the gene loadings of components associated with those motifs, validating our interpretation that covariation of expression of genes within many components reflects shared transcriptional regulation (Figure 7—figure supplement 1).


